| Issue |
A&A
Volume 599, March 2017
|
|
|---|---|---|
| Article Number | A65 | |
| Number of page(s) | 12 | |
| Section | Extragalactic astronomy | |
| DOI | https://doi.org/10.1051/0004-6361/201629181 | |
| Published online | 01 March 2017 | |
Searching for metal-deficient emission-line galaxy candidates: the final sample of the SDSS DR12 galaxies
1 Max-Planck-Institut für Radioastronomie, Auf dem Hügel 69, 53121 Bonn, Germany
2 Main Astronomical Observatory, Ukrainian National Academy of Sciences, Zabolotnoho 27, Kyiv 03680, Ukraine
e-mail: guseva@mao.kiev.ua
3 Institut für Astrophysik, Göttingen Universität, Friedrich-Hund-Platz 1, 37077 Göttingen, Germany
4 Astronomy Department, King Abdulaziz University, PO Box 80203, Jeddah 21589, Saudi Arabia
Received: 24 June 2016
Accepted: 2 November 2016
We present a spectroscopic study of metal-deficient dwarf galaxy candidates, selected from the SDSS DR12. The oxygen abundances were derived using the direct method in galaxies with the electron temperature-sensitive emission line [O iii]λ4363 Å measured with an accuracy better than 30%. The oxygen abundances for the remaining galaxies with larger uncertainties of the [O iii]λ4363 Å line fluxes were calculated using a strong-line semi-empirical method by Izotov and Thuan. The resulting sample consists of 287 low-metallicity candidates with oxygen abundances below 12 + log O/H = 7.65 including 23 extremely metal-deficient (XMD) candidates with 12 + log O/H ≤ 7.35. Ten out of sixteen XMDs known so far (or ~60%) have been discovered by our team using the direct method. Three XMDs were found in the present study. We study relations between global parameters of low-metallicity galaxies, including absolute optical magnitudes, Hβ luminosities (or equivalently star formation rates), stellar masses, mid-infrared colours, and oxygen abundances. Low-metallicity and XMD galaxies strongly deviate to lower metallicities in L–Z, L(Hβ)–Z and M∗–Z diagrams than in relations obtained for large samples of low-redshift, star-forming galaxies with non-restricted metallicities. These less chemically evolved galaxies with stellar masses ≈106–108M⊙, Hβ luminosities ≈1038–1041 erg s-1, SFR ≈ 0.01–1.0 M⊙ yr-1, and sSFR ~ 50 Gyr-1 have physical conditions which may be characteristic of high-redshift low-mass star-forming galaxies which are still awaiting discovery.
Key words: galaxies: abundances / galaxies: irregular / galaxies: evolution / galaxies: formation / galaxies: ISM / ISM: abundances
© ESO, 2017
1. Introduction
The discovery and subsequent study of gas-phase elemental abundances and global characteristics of low-metallicity and extremely metal-deficient (XMD) star-forming (SF) galaxies are important for investigations of the interstellar medium (ISM) conditions prevailing in the early Universe. They are also relevant in order to provide constraints to numerical models of chemical evolution and to study the young massive stellar population in the galaxies. These chemically unevolved galaxies allow us to study the key astrophysical processes occurring in the early Universe, and they also provide measurements of the primordial helium abundance as a test of Big Bang nucleosynthesis models. It is necessary to increase statistics of these galaxies to better constrain the lower metallicity threshold which is determined by the most metal-deficient galaxies. This observationally determined threshold near 12 +log O/H ~ 7 confirms the idea of the prior enrichment of the pristine gas by Population III stars (see e.g., Thuan et al. 2005).
Much attention has been focused on searching for XMD galaxies resulting in their steadily increasing number (Pustilnik et al. 2005, 2011; Izotov et al. 2006b, 2012; Izotov & Thuan 2007, 2009; Guseva et al. 2007, 2015; Berg et al. 2012; Hirschauer et al. 2016; Sánchez Almeida et al. 2016). The metallicity of a galaxy is customarily expressed in terms of the oxygen abundance 12 + log O/H. Exact values of the metallicity defining extremely metal-poor (XMP) and XMD galaxies are different in different studies (e.g., Kunth & Östlin 2000; Izotov & Thuan 2007; Izotov et al. 2012; Guseva et al. 2015; Sánchez Almeida et al. 2016), ranging from ~7.3 to ~7.8. In this paper we continue the search for the least metal-abundant galaxies in the local Universe, extracting them from the SDSS surveys. Our metallicity-restricted samples consist of a low-metallicity sample with oxygen abundance 12 + log O/H ≤ 7.65 including a subsample of XMD galaxies with 12 + logO/H ≤ 7.35.
The paper is organised as follows. The sample and element abundance determination are described in Sect. 2. The results are presented in Sect. 3. More specifically, the global properties of low-metallicity and XMD emission-line galaxies are analysed in Sect. 3.1, the luminosity-metallicity and mass-metallicity relations are discussed in Sect. 3.2. Relations between mid-infrared WISE colours and global parameters of the low-metallicity sample are presented in Sect. 3.3. Our main conclusions are summarised in Sect. 4.
General characteristics of newly identified XMD candidates.
2. Sample
We use a sample of ~35 190 star-forming galaxies selected from the SDSS DR12 spectroscopic database (~1.5 million galaxies, Alam et al. 2015) which were not included in the DR10 and earlier SDSS releases.
We excluded galaxies with evidence of AGN activity, such as broad emission lines or strong high-ionisation lines ([Ne v]λ3426 and He ii λ4686). We also excluded H ii regions in spiral galaxies by inspection of SDSS images. Furthermore, high-luminosity galaxies which are predominantly distant galaxies with Mg< −18 mag were also excluded. Finally, we select only low-metallicity galaxies with gas-phase metallicity lower than 12 + log O/H ≤ 7.65 (LMG sample) and extremely metal-deficient galaxies with 12 + log O/H ≤ 7.35 (XMD sample). The resulting sample consists of 287 LMG candidates including 23 XMD candidates. These new XMD candidates complement previous findings. The electron temperatures and oxygen abundances for 3 out of the 23 XMD galaxies were obtained by a direct method and are thus the most reliable ones.
The galaxy names, method of oxygen abundance determination, their coordinates, redshifts, apparent SDSS g magnitudes, absolute g magnitudes, and stellar masses are collected in Table 1. Galaxies with [O iii]λ4363 Å emission line signal-to-noise ratios between 2σ and 3σ are also included in the table and are marked by colons in Col. 2. Figure 1 shows SDSS spectra of XMD galaxies for which abundances were obtained by the direct method. Five of these galaxies (J0137+1810, J0141+2124, J0739+4434, J0945+3835, J1444+4237) have relatively noisy spectra with 2σ<S/N< 3σ in the [O iii]λ4363 Å emission line.
We measured the line fluxes and their errors using the IRAF1 SPLOT routine. The uncertainties of the line fluxes are propagated to calculate the uncertainties of electron temperatures, ionic and total heavy element abundances. We derived the internal extinction using the decrement of several Balmer hydrogen emission lines after correcting the observed spectra for the Milky Way extinction. The line fluxes were corrected for reddening (Cardelli et al. 1989) and for underlying hydrogen stellar absorption by the application of an iterative procedure (Izotov et al. 1994). The observed line fluxes F(λ)/F(Hβ), the extinction-corrected line fluxes I(λ)/I(Hβ) multiplied by 100, and the equivalent widths of emission lines for XMD candidates (direct method) are shown in Table A.1 together with extinction coefficients C(Hβ), observed Hβ fluxes, and equivalent widths EW(abs) of hydrogen absorption stellar lines.
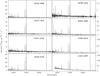 |
Fig. 1 SDSS spectra of the eight XMD candidates for which abundances were obtained by direct methods. Five galaxies (J0137+1810, J0141+2124, J0739+4434, J0945+3835, J1444+4237) have signal-to-noise ratios of 2σ<S/N< 3σ in the [O iii]λ4363 Å emission line. |
The [O iii]λ4363 Å emission lines detected at a level higher than 3σ were measured in 120 low-metallicity galaxies (LMG sample) including three XMDs (filled symbols in Figs. 2, 4, and 5). This allows for a reliable oxygen abundance determination using the direct Te method following the prescriptions of Izotov et al. (1994, 1997) and Thuan et al. (1995). The electron temperature Te(O iii) was determined from the emission-line ratio [O iii]λ4363/(λ4959 + λ5007) following Izotov et al. (1994, 1997). A semi-empirical method described by Izotov & Thuan (2007) to derive Te(O iii) was used for the remaining 168 LMG and XMD candidates. We adopt a two-zone photoionised H ii region model: a high-ionisation zone with temperature Te(O iii) where [O iii] and [Ne iii] lines originate, and a low-ionisation zone with temperature Te(O ii) where [O ii] lines originate. For Te(O ii), we use the relation between the electron temperatures Te(O iii) and Te(O ii) obtained by Izotov et al. (2006a) from the H ii photoionisation models of Stasińska & Izotov (2003). The [S ii]λλ6717, 6731 Å doublet is used to derive the electron density. Generally, the electron number density in the H ii regions of dwarf star-forming galaxies is low, satisfying the condition of the low-density limit (e.g. Ne< 104 cm-3 for the [S ii] and [O ii] emission lines and Ne< 105 cm-3 for the [O iii] emission lines). Therefore, for clarity Ne = 100 cm-3 was adopted in the cases of weak or absent of [S ii] emission lines. We note, that in the low-density limit the element abundance determination is insensitive to the value of the electron number density and its error.
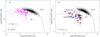 |
Fig. 2 log([Oiii]λ5007/Hβ) vs. log([Nii]λ6583/Hα) diagnostic diagram (BPT, Baldwin et al. 1981). a) Low-metallicity candidates with 12 + log O/H ≤ 7.65. Magenta filled circles denote the galaxies with oxygen abundances derived using the direct method, and magenta open circles indicate galaxies with oxygen abundances derived with the semi-empirical method by Izotov & Thuan (2007). Error bars at the lower left corner represent the mean range of errors for individual galaxies. b) XMD candidates with 12 +log O/H ≤ 7.35. XMD candidates with metallicities derived by the direct and semi-empirical methods are denoted by red filled circles and red open circles, respectively. The galaxies with the [O iii]λ4363 Å emission lines detected at a level higher than 3σ are denoted by large red filled symbols and galaxies detected at 2–3σ levels by small red filled circles. We also show the XMD emission-line galaxies and candidates with 12 +log O/H ≤ 7.35 by Izotov & Thuan (2007), Izotov et al. (2012) and Guseva et al. (2015) by small blue circles. The well-known metal-deficient BCDs I Zw 18, SBS 0335–052W, and SBS 0335–052E are represented by filled blue triangles and are labelled. The extremely metal-poor dwarf galaxies Leo P (Skillman et al. 2013) and AGC 198691 (Hirschauer et al. 2016) are plotted by a large open black square and a large open black diamond, respectively. For comparison we also plot in a) and b) a sample of 803 luminous compact galaxies (LCGs, black dots, Izotov et al. 2011a). The dashed line from Kauffmann et al. (2003) separates star-forming galaxies (SF) from active galactic nuclei (AGN). |
We derived ionic and total oxygen and neon abundances using expressions for ionic abundances and the ionisation correction factors for neon by Izotov et al. (2006a). In Table A.2 the electron temperatures Te (O iii) and Te(O ii), electron densities Ne, and oxygen and neon abundances are given for XMD galaxies and XMD galaxy candidates, where the abundances were obtained by the direct method. Apart from the three XMDs with accuracy of I(4363) better than 3σ we also show the five XMD galaxies that have lower levels of accuracy (30% <σ[I(4363)]/I(4363) < 50%). Three XMD candidates have uncertainties in electron temperatures approximately equal to or better than 3σ. For the remaining five XMDs uncertainties in electron temperatures are in the range of 1.4−2.7σ. They are marked by colons in Tables 1 and 2 and denoted by small red symbols in the diagnostic diagram (Fig. 2b).
Uncertainties in oxygen abundances of 0.3–0.4 dex for three out of the eight XMD galaxies in Table A.2 are somewhat high. Nevertheless, we keep these galaxies in the table because galaxies with extremely low metallicities are very rare in the local Universe. These data can provide useful guidelines for future higher sensitivity observations of the candidates with larger telescopes to improve the oxygen abundance determinations.
Most metal-deficient emission-line galaxies.
3. Results
3.1. Global parameters of the low-metallicity sample
We show in Fig. 2 the location of the LMG and XMD samples on the standard emission-line ratio diagnostic diagram (BPT, Baldwin et al. 1981) to check the validity of our selection criteria. It is seen that all newly discovered LMGs are located below the dashed demarcation line whose location was determined by Kauffmann et al. (2003) in the region of star-forming galaxies. Furthermore, in agreement with results by Guseva et al. (2015) and Izotov et al. (2012), the most metal-deficient galaxies in Fig. 2b occupy the region considerably below the lines separating star-forming galaxies and AGN and are located below the region, where the luminous compact galaxies (LCGs) from Izotov et al. (2011a) are found (black dots).
Initially the XMD region was only populated by a few galaxies, for example I Zw 18 and SBS 0335-052. New discoveries of XMDs, for example Leo P (Skillman et al. 2013), DDO 68 (Pustilnik et al. 2005; Izotov & Thuan 2007, 2009), new XMD candidates (Izotov & Thuan 2007; Izotov et al. 2012; Guseva et al. 2015), and AGC 198691 (Hirschauer et al. 2016), greatly increased their number (Fig. 2b). Our new galaxies discussed in this paper further increase the number of known XMD galaxies and XMD candidates.
However, the fraction of XMDs among emission-line galaxies is very small. Twenty-three XMD candidates out of ~35 190 emission-line galaxies extracted from the SDSS DR12 (<0.1%) have been found, indicating that these objects are very scarce in the Local Universe.
Among the known XMD galaxies (Table 2), none with an oxygen abundance 12 +log O/H < 7.0 has been found so far, in agreement with previous results by Izotov & Thuan (2007), Izotov et al. (2012), Guseva et al. (2015), Sánchez Almeida et al. (2016), and Hirschauer et al. (2016). This threshold is very close to the neutral gas metallicity ~7.0 in some dwarf star-forming galaxies and to the metallicities in Lyα absorbers (Prochaska et al. 2003) supporting the idea of the prior enrichment of the primordial gas to the level of 12 + log O/H ~ 7.0 (or ~1–2% of Sun) by Population III stars (see e.g., Thuan et al. 2005). Theoretically, the existence of nearby zero-metal galaxies is not excluded, but they cannot be easily identified because of a lack of [O iii] and [O ii] emission lines. We also note, that such objects are likely much less common even than XMDs.
Figure 3 presents the distributions of some global characteristics of LMGs. Average values in all six panels are depicted by red dotted vertical lines. The redshift distribution with the average redshift of z ~ 0.04 is shown in Fig. 3a. The average redshift is approximately the same as that for the large non-metallicity-limited sample of ~14 000 dwarf star-forming galaxies from the SDSS DR7 (Izotov et al. 2014).
The brightest galaxies in our luminosity-limited sample have Mg = −18 mag. Therefore the average extinction-corrected absolute magnitude Mg of −15.5 mag in Fig. 3b is much fainter than for the sample of compact dwarf star-forming galaxies discussed by Izotov et al. (2014).
In Fig. 3e the galaxies are distributed in a relatively narrow range of aperture-corrected logarithms of total stellar masses logM⋆/M⊙ from ~6 to 9 with an average value of 7.3, which is lower than the value of ~9 for the compact dwarf star-forming galaxies considered by Izotov et al. (2014).
The average mass of the young stellar populations with ages of a few Myr is 6.25 in log scale (Fig. 3f) corresponding to the very high average fraction (by mass) of ~9% of the young stellar population. This is much higher than the average value of ~2% for the mass fraction of the young stellar population in the sample of Izotov et al. (2014).
Galaxies from our sample are characterised by an average equivalent width of the Hβ emission line of ~80 Å (Fig. 3d), higher than the average EW(Hβ) ~ 31 Å for the galaxies by Izotov et al. (2014).
Usually the extinction coefficient C(Hβ) at the Hβ wavelength for dwarf star-forming galaxies is low with an average value ~0.2–0.4 (see e.g. Guseva et al. 2009, 2011, 2013; Izotov et al. 2014; Guseva et al. 2015). Figure 3c shows the distribution of C(Hβ) for our galaxies varying in the range from 0 to 0.4 with very low average value <0.1 corresponding to an extinction AV in the V band of less than 0.2 mag. This average value is even lower than that for the non-metallicity-limited samples, hinting to a possibility of a light dependence of C(Hβ) on metallicity.
3.2. Luminosity-metallicity and mass-metallicity relations
In this section, we discuss the distributions of the LMGs and XMDs in the broad-band luminosity-metallicity, Hβ luminosity-metallicity, and mass-metallicity diagrams. We compare our XMD candidates with similar galaxies analysed by Izotov et al. (2006a, 2011a, 2012, 2014), Izotov & Thuan (2007), and Guseva et al. (2015).
The L–Z relation between optical luminosities expressed in extinction-corrected absolute SDSS g-band magnitudes Mg (Table 1) and metallicities of galaxies is shown in Fig. 4a for the LMG and XMD samples. The distances to the galaxies are derived from their radial velocities, adopting a Hubble constant H0 = 67.3 km s-1 Mpc-1 (Planck Collaboration XVI 2014).
The position of all XMD candidates from this paper (large red filled and open circles) and from Izotov & Thuan (2007), Izotov et al. (2012), and Guseva et al. (2015) (small blue circles) are plotted. We also show the positions of the most metal-deficient BCDs – I Zw 18, SBS 0335–052W, SBS 0335–052E (filled blue triangles) – as well as Leo P and AGC 198691 (large open black square and diamonds in Fig. 4). For comparison, in Fig. 4a the SDSS galaxies by Izotov et al. (2006a) and star-forming galaxies from Izotov & Thuan (2007), as a representative sample, are plotted by black dots. The standard L–Z relation for emission-line galaxies by Izotov et al. (2006a) and Izotov & Thuan (2007) is shown (solid line). We aim to examine how much the LMG and XMD samples differ from the star-forming galaxies in standard samples. For the XMD sample we show error bars in oxygen abundances derived by the direct and semi-empirical methods. We note, that the errors in electron temperature, electron number density and ionic and total abundances are usually larger for the direct method because the [O iii]λ4363 emission line is always weaker than [O ii]λ3727 and [O iii]λ5007 emission lines used in so-called strong-line methods, particularly in the semi-empirical method. The direct method is considered to be the physically most reasonable method, while strong-line methods are subject to large systematic errors, despite the lower statistical errors.
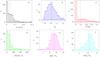 |
Fig. 3 Distributions of low-metallicity candidates with 12 + log O/H ≤ 7.65 (N = 287, the same objects as those shown in Fig. 2a by magenta symbols) on a) the redshift z; b) the extinction-corrected absolute SDSS g-magnitude Mg; c) the extinction coefficient C(Hβ); d) the equivalent width EW(Hβ) of the Hβ emission line; e) the total stellar mass M⋆; f) the mass My of the young stellar population. Dotted vertical lines in all panels indicate mean values of the distributions. |
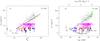 |
Fig. 4 a) Absolute SDSS g magnitude-oxygen abundance relation for the galaxies with oxygen abundances 7.35 ≤ 12 + log O/H ≤ 7.65 derived by the direct method (magenta filled triangles) and for galaxies with oxygen abundances derived by the semi-empirical method of Izotov & Thuan (2007; magenta open triangles). Three XMD candidates with 12 + logO/H ≤ 7.35 (this paper), denoted by large red filled circles and identified by the direct metallicity determination, are shown together with large red open circles representing sources with semi-empirical determinations. The total number of the LMG sample shown by magenta and red symbols is 287. We also show the XMD emission-line galaxies and candidates with 12 + log O/H ≤ 7.35 from Izotov & Thuan (2007), Izotov et al. (2012) and Guseva et al. (2015) by small blue circles. Well-known metal-deficient BCDs I Zw 18, SBS 0335–052W, and SBS 0335–052E are shown by filled blue triangles and are labelled in b). The extremely metal-poor dwarf galaxies Leo P (Skillman et al. 2013) and AGC 198691 (Hirschauer et al. 2016) are plotted respectively by a large open black square and large open black diamonds corresponding to three different distances. For comparison, the standard L–Z relation for emission-line galaxies (Izotov et al. 2006a; Izotov & Thuan 2007) is shown by black dots with the linear regression to these data (solid line). b) Extinction- and aperture-corrected Hβ luminosity-oxygen abundance relation. The samples and symbols are the same as in a). The black dots represent the SDSS galaxies from Izotov et al. (2006a), and all galaxies from Izotov & Thuan (2007) and Izotov et al. (2012). The black solid line denotes the linear regression to these data, excluding I Zw 18 and SBS 0335–052W. The filled green squares represent the high-redshift star-forming galaxies by Cullen et al. (2014). |
Most XMDs occupy the same region in the L–Z diagram as the well-known metal-deficient BCDs I Zw 18 and SBS 0335–052E. All these galaxies are systematically shifted to lower metallicities relative to the standard line for every bin of the Mg range from −12 to −18 mag. Considering a higher oxygen abundance bin 7.35 ≤ 12 + log (O/H) ≤ 7.65 (magenta symbols) we find a similar scatter of galaxies in absolute magnitude. These galaxies fill the gap between the solid line in Fig. 4a and the location of XMDs with 12 + log(O/H) ≤ 7.35. The same conclusion was made by Kniazev et al. (2003) and Guseva et al. (2009, 2015).
In Fig. 4b, the diagram of extinction- and aperture-corrected (see Izotov et al. 2015) Hβ luminosity L(Hβ) metallicity is plotted for the same samples as in Fig. 4a. The upper axis provides a scale for the star formation rate (SFR), derived from the extinction- and aperture-corrected Hα luminosity as defined by Kennicutt (1998).
The XMD galaxies with oxygen abundances obtained by the direct method (three large red filled circles in Fig. 4) are shifted down to lower metallicities by about 0.4–0.6 dex at fixed Mg and to brighter Mg by more than 5–6 mag at fixed 12 + logO/H relative to the standard L–Z relation (black solid line). The galaxies with weaker or non-detected [O iii]λ4363 emission line and hence with metallicities derived by the semi-empirical method are less shifted along the Mg and L(Hβ) scales.
As seen in Fig. 4b, most of our new XMD candidates have Hβ luminosities ranging from ~1038 to 1041 erg s-1 and SFRs in the range ~0.01–1.0 M⊙ yr-1, which are comparable to the SFRs of I Zw 18 and the SBS 0335–052 system. Our XMDs with metallicities obtained using the semi-empirical method have a larger spread in Mg and log L(Hβ) and about half of them have L(Hβ) in the range ~1035 to 1038 erg s-1 corresponding to lower (log SFR = −4–−2 M⊙ yr-1) star formation activity in lower excitation H ii regions. They are located in the region close to that of the low-mass galaxies in the leftmost end of the L–Z and L(Hβ)–Z relations (Figs. 4a and b, respectively) and which are populated by objects such as Leo P, AGC 198691 and J0143+1958 (Skillman et al. 2013; Hirschauer et al. 2016; Guseva et al. 2015,respectively).
Summarising, intense starbursts with high SFRs, like the well-known BCDs I Zw 18 and SBS 0335–052E (Sargent & Searle 1970; Izotov et al. 1990), are present in 17 out of 23 XMD candidates. These XMD galaxies are relatively luminous and chemically unevolved galaxies with strong ongoing star formation. Inclusion of these galaxies in the L−Z and L(Hβ)−Z relations would result in shallower slopes (Guseva et al. 2009). Furthermore, known XMDs with 12 + log(O/H) < 7.35, together with the XMD candidates from this paper, do not show a dependence on metallicity.
Stellar mass is one of the central parameters characterising galaxies, and the relation between this parameter and the galaxy metallicity is a fundamental relation between the two global galaxy properties. Mass is more fundamentally related to metallicity than luminosity. The luminosity of a galaxy, especially a dwarf galaxy, depends greatly on its present phase of star formation, while stellar mass and metallicity are both determined by the evolution of the galaxy.
To derive stellar masses we modelled spectral energy distributions (SEDs) in the entire spectral range of λλ3600–10 300 Å, subtracted nebular line and continuum emission which is significant in the spectra of star-forming galaxies. Neglecting the correction for nebular continuum emission would result in a considerable overestimate of the galaxy stellar mass. The SED of the nebular continuum is taken from Aller (1984) and includes hydrogen and helium free-bound, free-free, and two-photon emission. The shape of the spectrum also depends on reddening. The extinction coefficient C(Hβ) is obtained from the observed hydrogen Balmer decrement. To account for the contribution of the stellar emission, we have adopted the grid of the Padua stellar evolution models by Girardi et al. (2000).
Each SED also depends on the adopted star formation history. The bursting nature of star formation and young burst ages have recently been confirmed for a large sample of compact star-forming galaxies by Izotov et al. (2016). The star formation in our galaxies occurs in short strong bursts while the contribution of the continuous star formation is low. So, we approximated the star formation history in each galaxy by a recent short burst with age t(young) <10 Myr, which accounts for the young stellar population, and a prior continuous star formation responsible for the older stars with age varying between 10 Myr and 15 Gyr. The contribution of each stellar population to the SED is parameterised by the ratio of the masses of the old to young stellar populations, b = M(old) /M(young), which we vary between 0.01 and 1000.
We carried out 104 Monte Carlo simulations to reproduce the SED of each galaxy in our sample. The method is based on fitting the model SEDs to the observed ones and finding the best fit (for details see e.g., Guseva et al. 2006, 2007; Izotov et al. 2011a, 2015).
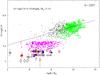 |
Fig. 5 Stellar mass – oxygen abundance relation for the same samples as in Fig. 4 shown by the same symbols. For comparison, the SDSS DR7 emission-line galaxy sample from Izotov et al. (2014), where the errors of the [O iii]λ4363 emission-line fluxes do not exceed 25%, are shown by black dots with the linear likelihood regression for these data plotted by a solid black line. The location of high-redshift star-forming galaxies is shown by various large green symbols (see text). |
In Fig. 5 we show our LMG and XMD candidates on the extinction- and aperture-corrected stellar mass-metallicity (M⋆–Z) diagram. The same samples and symbols as in Fig. 4 are used. The solid line is the M⋆–Z relation obtained by Izotov et al. (2014) for SDSS DR7 emission-line galaxies with robust metallicity determinations (black dots).
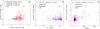 |
Fig. 6 a) m(3.4 μm)–m(4.6 μm) vs. m(4.6 μm)–m(12 μm) colour–colour diagram for a sample of emission-line galaxies detected in the three WISE bands 3.4 μm (W1), 4.6 μm (W2), and 12 μm (W3). Galaxies with equivalent widths of the Hβ emission line EW(Hβ) ≥ 50Å and L(Hβ) ≥ 3 × 1040 erg s-1 are shown by filled red circles; galaxies with EW(Hβ) < 50Å and L(Hβ) < 3 × 1040 erg s-1 are depicted by open blue circles. The galaxy with m(3.4 μm)–m(4.6 μm) = 2.73 mag (J1353+1649) discovered here, is shown by a large black filled circle in all three panels. b) W1–W2 colour vs. oxygen abundance. The sample is split into two parts with high and low EW(Hβ). Nearby galaxies with redshifts less than 0.01 are presented by crosses (red for the galaxies with high EW(Hβ) and blue for low equivalent widths of Hβ). The remaining galaxies are presented by the same symbols as in a). c) W1–W2 vs. EW(Hβ) is shown for nearby galaxies (redshift z< 0.01, black crosses) and for more distant galaxies (z ≥ 0.01, filled magenta circles). |
The 23 newly discovered XMD candidates are plotted by large red circles, filled and open for direct and semi-empirical methods, respectively. The XMDs are dwarf galaxies and their masses spread over three orders of magnitude from 105 to 108M⊙. Most of them, except several low-mass galaxies with M⋆< 106M⊙, are located in the region of I Zw 18 and SBS 0335–052E. For their range of stellar masses the oxygen abundances in these galaxies are ~0.5 dex (or 3–4 times) lower than those predicted from the M⋆–Z relation for the SDSS DR7 emission-line galaxy sample. Thus, these galaxies are the least chemically evolved galaxies. Our low-metallicity sample (7.35 ≤ 12 + log O/H ≤ 7.65) denoted as magenta filled and open triangles in Fig. 5 shows a similar spread in stellar masses spanning three orders of magnitude, but are shifted to slightly larger masses 106–109M⊙. Thus, some hint of the dependence of the stellar mass on metallicity is present if only XMD and LMG samples are considered. However, this relation deviates from the standard M⋆–Z relation produced for a large non-metallicity-restricted sample of galaxies (see e.g., the sample with metallicities derived by the direct method by Izotov et al. 2015). For comparison, several samples of high-redshift star-forming galaxies are shown in Fig. 5 by various large green symbols. Specifically 6 galaxies are shown at z> 2 by Cullen et al. (2014), 96 galaxies at 2.0 <z< 2.6 by Steidel et al. (2014), 6 galaxies at z ~ 2 by Maier et al. (2014), 7 galaxies at z ~ 3.5 by Maiolino et al. (2008), 30 galaxies at redshifts z ~ 3.4 by Troncoso et al. (2014), and 4 galaxies at z ~ 2.3 by Sanders et al. (2015). Oxygen abundances for all high-z galaxies are calculated with O3N2 or O3O2 calibrations from Izotov et al. (2015, their Eqs. (2) and (3)). A small shift to lower metallicities is present for these high-redshift galaxies compared to the standard relation for a large non-metallicity-restricted sample of local star-forming galaxies (black linear regression).
With newly discovered XMDs we confirm our previous findings that the low-metallicity dwarf galaxies are characterised by very high specific star formation rates (sSFR) of ~50 Gyr-1, which are in the range of sSFRs for star-forming galaxies at high redshifts ~2–4 (Cullen et al. 2014; Steidel et al. 2014; Maiolino et al. 2008; Maier et al. 2014; Troncoso et al. 2014).
3.3. WISE data for the sample of metal-poor candidates
In this section we study the properties of LMG and XMD candidates in the mid-infrared range. To this end, the SDSS spectroscopic data of our LMG sample were supplemented by photometric data from the Wide-field Infrared Survey Explorer (WISE) All-Sky Source Catalogue (ASSC; Wright et al. 2010). Specifically, we use the mid-infrared photometry in W1, W2, and W3 bands (m(3.4 μm), m(4.6 μm), and m(12 μm)), measured by the WISE collaboration. The typical errors in each band are less than ±0.1 mag.
One of our aims is to search for galaxies with warm and hot dust. Galaxies with hot dust emission have been searched using the galaxies with very red mid-infrared m(3.4 μm)–m(4.6 μm) colours of more than 2 mag. Very red W1–W2 colour indicates a sharp increase in intensity at 4.6 μm as compared to 3.4 μm owing to the presence of hot dust in the galaxy. This is opposite to the galaxies without hot dust emission which are characterised by bluer W1–W2 colours. More specifically Izotov et al. (2014) showed that stellar and interstellar ionised gas emission are characterised by W1–W2 colours of ~0 and ~0.7 mag, respectively. This indicates that the colours W1–W2 ≳ 2.0 mag can be signatures of hot dust with temperatures reaching several hundred Kelvin. Such galaxies are fairly rare. Only 7 galaxies were found in the WISE Preliminary Release Source Catalogue (PRSC) by Griffith et al. (2011) and Izotov et al. (2011b) and 20 SDSS galaxies were found by Izotov et al. (2014) in the WISE ASSC.
From the LMG sample we selected 195 galaxies, which were detected in the WISE W1, W2 and W3 bands. These galaxies are shown in Fig. 6a on the (W1–W2) vs. (W2–W3) colour–colour diagram. We split the sample into two subsamples with equivalent widths of the Hβ line EW(Hβ) ≥ 50Å and with the Hβ luminosities L(Hβ) ≥ 3 × 1040 erg s-1 (red symbols) and EW(Hβ) < 50 Å and L(Hβ) < 3 × 1040 erg s-1 (blue symbols). In the starburst scenario, which is relevant for our galaxies with strong ongoing star formation, EW(Hβ) is rapidly decreasing with age and therefore it is a good signature of the star formation burst age.
Similarly to previous studies (Griffith et al. 2011; Izotov et al. 2011b, 2014), we did not find an appreciable number of new galaxies with very hot dust emission. The bulk of the galaxies (~85%) have low mid-infrared colours W1–W2 < 0.7 mag. There are 14 out of 195 galaxies with a considerable contribution of the hot dust emission and W1–W2 colours redder than 1–2 mag. The very hot dust emission is likely present only in one new galaxy J1353+1649 with oxygen abundance 12 + logO/H ~ 7.6 according to very red colour W1–W2 of 2.73 mag (large black filled circle). In general, the mid-infrared colour–colour diagrams of our metallicity-limited sample (Fig. 6a) and of a large sample of ~10 000 galaxies from the SDSS DR7 in Izotov et al. (2014, their Fig. 7c) are very similar. Most Hβ luminous galaxies with high-excitation H ii regions and smaller star formation ages have redder W1–W2 and W2–W3 colours (red points are clearly shifted to redder colours relative to the blue ones in Fig. 6a). This implies that the main source of dust heating is radiation from young star-forming regions.
In Fig. 6b our sample is split into two parts: EW(Hβ) ≥ 50Å (red filled circles) and EW(Hβ) < 50Å (blue open circles). The nearby galaxies with redshifts less than 0.01 are presented in the figure by crosses (red for the galaxies with high equivalent widths of Hβ and blue for low EW(Hβ)). We note that the distant galaxies with redshifts z> 0.01 in Fig. 6b have a much wider spread in colours than nearby galaxies. We have significantly added to the previously known galaxies in the range of 12 +log O/H from 7.2 to 7.65 with known W1–W2 colours as compared to the data by Izotov et al. (2011b, 2014) and Griffith et al. (2011) where the metallicity range is substantially wider. However, there is no dependence of mid-infrared colour on the metallicity for all these samples, including our. Thus, metallicity is not the main factor affecting the heating of interstellar dust.
It can be clearly seen in Fig. 6c that the W1–W2 colour becomes increasingly redder with increasing equivalent width of the Hβ emission line (larger EW(Hβ), corresponding to younger bursts of star formation) for both the nearby and more distant galaxies shown by crosses and filled circles, respectively. This suggests that the main contributor to the interstellar dust heating is the most recent burst of star formation.
4. Conclusions
We present a spectroscopic study of low-metallicity galaxy (LMG) emission-line candidates and extremely metal-deficient (XMD) emission-line candidates selected from the data release 12 (DR12) of the Sloan Digital Sky Survey (SDSS), a part of the SDSS-III survey. Our main results are as follows.
We derived oxygen abundances of 12 + log O/H ≤ 7.65 in 287 low-metallicity galaxies. Out of this number, the [O iii]λ4363 Å emission line was detected at a level higher than 3σ in 120 galaxies including three galaxies which were classified as XMD candidates. This allowed us to derive their oxygen abundance using the direct method. The semi-empirical method was used for the remaining 168 galaxies.
Seventeen out of 23 newly discovered XMD candidates are characterised by strong SF activity and high SFRs, like two well-known BCDs I Zw 18 and SBS 0335–052E (Sargent & Searle 1970; Izotov et al. 1990).
No emission-line galaxies with 12 + log O/H ≲ 7.0 were found in the entire SDSS DR12 survey and among the other galaxies collected from the literature (this paper and Izotov et al. 2012; Guseva et al. 2015). This finding supports conclusions by Thuan et al. (2005), Izotov et al. (2012), and Guseva et al. (2015) that the matter from which XMDs were formed was probably pre-enriched to this level prior to the galaxy formation.
The XMDs with strong SF activity are the most prominent outliers in the luminosity-metallicity (L–Z), Hβ luminosity-metallicity (L(Hβ)–Z) and mass-metallicity relations, substantially increasing the dispersion at the low-metallicity end of the relations.
Extreme positions of the most massive and luminous XMDs in the mass-metallicity diagrams imply that these galaxies with stellar masses ~107 are not yet chemically enriched.
Acknowledgments
Y.I.I. and N.G.G. thank the Max-Planck Institute for Radioastronomy, Bonn, Germany, for the hospitality. Funding for the Sloan Digital Sky Survey (SDSS-III) has been provided by the Alfred P. Sloan Foundation, the Participating Institutions, the National Science Foundation, the US Department of Energy, the National Aeronautics and Space Administration, the Japanese Monbukagakusho, and the Max Planck Society, the Higher Education Funding Council for England.
References
- Alam, S., Albareti, F. D., Allen de Prieto, C., et al. 2015, ApJS, 219, 12 [NASA ADS] [CrossRef] [Google Scholar]
- Aller, L. H. 1984, Physics of Thermal Gaseous Nebulae (Dordrecht: Reidel) [Google Scholar]
- Baldwin, J. A., Phillips, M. M., & Terlevich, R. 1981, PASP, 93, 5 [NASA ADS] [CrossRef] [EDP Sciences] [Google Scholar]
- Berg, D. A., Skillman, E. D., Marble, A. R., et al. 2012, ApJ, 754, 98 [NASA ADS] [CrossRef] [Google Scholar]
- Cardelli, J. A., Clayton, G. C., & Mathis, J. S. 1989, ApJ, 345, 245 [NASA ADS] [CrossRef] [Google Scholar]
- Cullen, F., Cirasuolo, M., McLure, R. J., Dunlop, J. S., & Bowler, R. A. A. 2014, MNRAS, 440, 2300 [NASA ADS] [CrossRef] [Google Scholar]
- Girardi, L., Bressan, A., Bertelli, G., & Chiosi, C. 2000, A&AS, 141, 371 [NASA ADS] [CrossRef] [EDP Sciences] [Google Scholar]
- Griffith, R. L., Tsai, C.-W., Stern, D., et al. 2011, ApJ, 736, L22 [NASA ADS] [CrossRef] [Google Scholar]
- Guseva, N. G., Izotov, Y. I., & Thuan, T. X. 2006, ApJ, 644, 890 [NASA ADS] [CrossRef] [Google Scholar]
- Guseva, N. G., Izotov, Y. I., Papaderos, P., & Fricke, K. J. 2007, A&A, 464, 885 [NASA ADS] [CrossRef] [EDP Sciences] [Google Scholar]
- Guseva, N. G., Papaderos, P., Meyer, H., Izotov, Y. I., & Fricke, K. J. 2009, A&A, 505, 63 [NASA ADS] [CrossRef] [EDP Sciences] [Google Scholar]
- Guseva, N. G., Izotov, Y. I., Stasińska, G., et al. 2011, A&A, 529, A149 [NASA ADS] [CrossRef] [EDP Sciences] [Google Scholar]
- Guseva, N. G., Izotov, Y. I., Fricke, K. J., & Henkel, C. 2013, A&A, 555, A90 [NASA ADS] [CrossRef] [EDP Sciences] [Google Scholar]
- Guseva, N. G., Izotov, Y. I., Fricke, K. J., & Henkel, C. 2015, A&A, 579, A11 [NASA ADS] [CrossRef] [EDP Sciences] [Google Scholar]
- Hirschauer, A. S., Salzer, J. J., Skillman, E. D., et al. 2016, ApJ, 822, 108 [NASA ADS] [CrossRef] [Google Scholar]
- Izotov, Y. I., & Thuan, T. X. 2007, ApJ, 665, 1115 [NASA ADS] [CrossRef] [Google Scholar]
- Izotov, Y. I., & Thuan, T. X. 2009, ApJ, 690, 1797 [NASA ADS] [CrossRef] [Google Scholar]
- Izotov, Y. I., Guseva, N. G., Lipovetsky, V. A., Kniazev, A. Y., & Stepanian, J. A. 1990, Nature, 343, 238 [NASA ADS] [CrossRef] [Google Scholar]
- Izotov, Y. I., Thuan, T. X., & Lipovetsky, V. A. 1994, ApJ, 435, 647 [NASA ADS] [CrossRef] [Google Scholar]
- Izotov, Y. I., Thuan, T. X., & Lipovetsky, V. A. 1997, ApJS, 108, 1 [NASA ADS] [CrossRef] [Google Scholar]
- Izotov, Y. I., Stasińska, G., Meynet, G., Guseva, N. G., & Thuan, T. X. 2006a, A&A, 448, 955 [NASA ADS] [CrossRef] [EDP Sciences] [Google Scholar]
- Izotov, Y. I., Papaderos, P., Guseva, N. G., Fricke, K. J., & Thuan, T. X. 2006b, A&A, 454, 137 [NASA ADS] [CrossRef] [EDP Sciences] [Google Scholar]
- Izotov, Y. I., Guseva, N. G., Fricke, K. J., & Papaderos, P. 2009, A&A, 503, 61 [NASA ADS] [CrossRef] [EDP Sciences] [Google Scholar]
- Izotov, Y. I., Guseva, N. G., & Thuan, T. X. 2011a, ApJ, 728, 161 [NASA ADS] [CrossRef] [Google Scholar]
- Izotov, Y. I., Guseva, N. G., Fricke, K. J., & Henkel, C. 2011b, A&A, 536, L7 [NASA ADS] [CrossRef] [EDP Sciences] [Google Scholar]
- Izotov, Y. I., Thuan, T. X., & Guseva, N. G. 2012, A&A, 546, A122 [NASA ADS] [CrossRef] [EDP Sciences] [Google Scholar]
- Izotov, Y. I., Guseva, N. G., Fricke, K. J., & Henkel, C. 2014, A&A, 561, A33 [NASA ADS] [CrossRef] [EDP Sciences] [Google Scholar]
- Izotov, Y. I., Guseva, N. G., Fricke, K. J., & Henkel, C. 2015, MNRAS, 451, 2251 [NASA ADS] [CrossRef] [Google Scholar]
- Izotov, Y. I., Guseva, N. G., Fricke, K. J., & Henkel, C. 2016, MNRAS, 462, 4427 [NASA ADS] [CrossRef] [Google Scholar]
- Kauffmann, G., Heckman, T. M., Tremonti, C., et al. 2003, MNRAS, 346, 1055 [Google Scholar]
- Kennicutt, R. C., Jr. 1998, ARA&A, 36, 189 [Google Scholar]
- Kniazev, A. Y., Grebel, E. K., Hao, L., Strauss, et al. 2003, ApJ, 593, 73 [NASA ADS] [CrossRef] [Google Scholar]
- Kunth, D., & Östlin, G. 2000, A&ARv, 10, 1 [NASA ADS] [CrossRef] [Google Scholar]
- Maier, C., Lilly, S. J., Ziegler, B. L., Pérez Montero, E., Peng, Y., & Balestra, I. 2014, ApJ, 792, 3 [NASA ADS] [CrossRef] [Google Scholar]
- Maiolino, R., Nagao, T., Grazian, A., et al. 2008, A&A, 488, 463 [NASA ADS] [CrossRef] [EDP Sciences] [Google Scholar]
- Planck Collaboration XVI. 2014, A&A, 571, A16 [NASA ADS] [CrossRef] [EDP Sciences] [Google Scholar]
- Prochaska, J. X., Gawiser, E., Wolfe, A. M., Castro, S., & Djorgovski, S. G. 2003, ApJ, 595, L9 [NASA ADS] [CrossRef] [Google Scholar]
- Pustilnik, S. A., Kniazev, A. Y., & Pramskij, A. G. 2005, A&A, 443, 91 [NASA ADS] [CrossRef] [EDP Sciences] [Google Scholar]
- Pustilnik, S. A., Teplyakova, A. L., Kniazev, A. Y., Martin, J.-M., & Burenkov, A. N. 2010, MNRAS, 401, 333 [NASA ADS] [CrossRef] [Google Scholar]
- Pustilnik, S. A., Teplyakova, A. L., Kniazev, A. Y. 2011,Astrophys. Bull., 66, 255 [Google Scholar]
- Sánchez Almeida, J., Pérez-Montero, E., Morales-Luis, A. B., et al. 2016, ApJ, 819, 110 [NASA ADS] [CrossRef] [Google Scholar]
- Sanders, R. L., Shapley, A. E., Kriek, M., et al. 2015, ApJ, 799, 138 [NASA ADS] [CrossRef] [Google Scholar]
- Sargent, W. L. W., & Searle, L. 1970, ApJ, 162, L155 [NASA ADS] [CrossRef] [Google Scholar]
- Skillman, E. D., Kennicutt, R. C., Jr. & Hodge, P. W. 1989, ApJ, 347, 875 [NASA ADS] [CrossRef] [Google Scholar]
- Skillman, E. D., Salzer, J. J., Berg, D. A., et al. 2013, AJ, 146, 3 [NASA ADS] [CrossRef] [Google Scholar]
- Stasińska, G., & Izotov, Y. I. 2003, A&A, 397, 71 [NASA ADS] [CrossRef] [EDP Sciences] [Google Scholar]
- Steidel, C. S., Shapley, A. E., Kriek, M., et al. 2014, ApJ, 795, 165 [NASA ADS] [CrossRef] [Google Scholar]
- Thuan, T. X., & Izotov, Y. I. 2005, ApJS, 161, 240 [NASA ADS] [CrossRef] [Google Scholar]
- Thuan, T. X., Izotov, Y. I., & Lipovetsky, V. A. 1995, ApJ, 445, 108 [NASA ADS] [CrossRef] [Google Scholar]
- Thuan, T. X., Lecavelier des Etangs, A., & Izotov, Y. I. 2005, ApJ, 621, 269 [NASA ADS] [CrossRef] [EDP Sciences] [Google Scholar]
- Troncoso, P., Maiolino, R., Sommariva, V., et al. 2014, A&A, 563, A58 [NASA ADS] [CrossRef] [EDP Sciences] [Google Scholar]
- van Zee, L. 2000, ApJ, 543, L31 [NASA ADS] [CrossRef] [Google Scholar]
- Wright, E. L., Eisenhardt, P. R. M., Mainzer, A. K., et al. 2010, AJ, 140, 1868 [NASA ADS] [CrossRef] [Google Scholar]
Appendix A: Additional tables
Emission line intensities and equivalent widths.
Ionic and total heavy element abundances.
All Tables
All Figures
|
Fig. 1 SDSS spectra of the eight XMD candidates for which abundances were obtained by direct methods. Five galaxies (J0137+1810, J0141+2124, J0739+4434, J0945+3835, J1444+4237) have signal-to-noise ratios of 2σ<S/N< 3σ in the [O iii]λ4363 Å emission line. |
| In the text | |
|
Fig. 2 log([Oiii]λ5007/Hβ) vs. log([Nii]λ6583/Hα) diagnostic diagram (BPT, Baldwin et al. 1981). a) Low-metallicity candidates with 12 + log O/H ≤ 7.65. Magenta filled circles denote the galaxies with oxygen abundances derived using the direct method, and magenta open circles indicate galaxies with oxygen abundances derived with the semi-empirical method by Izotov & Thuan (2007). Error bars at the lower left corner represent the mean range of errors for individual galaxies. b) XMD candidates with 12 +log O/H ≤ 7.35. XMD candidates with metallicities derived by the direct and semi-empirical methods are denoted by red filled circles and red open circles, respectively. The galaxies with the [O iii]λ4363 Å emission lines detected at a level higher than 3σ are denoted by large red filled symbols and galaxies detected at 2–3σ levels by small red filled circles. We also show the XMD emission-line galaxies and candidates with 12 +log O/H ≤ 7.35 by Izotov & Thuan (2007), Izotov et al. (2012) and Guseva et al. (2015) by small blue circles. The well-known metal-deficient BCDs I Zw 18, SBS 0335–052W, and SBS 0335–052E are represented by filled blue triangles and are labelled. The extremely metal-poor dwarf galaxies Leo P (Skillman et al. 2013) and AGC 198691 (Hirschauer et al. 2016) are plotted by a large open black square and a large open black diamond, respectively. For comparison we also plot in a) and b) a sample of 803 luminous compact galaxies (LCGs, black dots, Izotov et al. 2011a). The dashed line from Kauffmann et al. (2003) separates star-forming galaxies (SF) from active galactic nuclei (AGN). |
| In the text | |
|
Fig. 3 Distributions of low-metallicity candidates with 12 + log O/H ≤ 7.65 (N = 287, the same objects as those shown in Fig. 2a by magenta symbols) on a) the redshift z; b) the extinction-corrected absolute SDSS g-magnitude Mg; c) the extinction coefficient C(Hβ); d) the equivalent width EW(Hβ) of the Hβ emission line; e) the total stellar mass M⋆; f) the mass My of the young stellar population. Dotted vertical lines in all panels indicate mean values of the distributions. |
| In the text | |
|
Fig. 4 a) Absolute SDSS g magnitude-oxygen abundance relation for the galaxies with oxygen abundances 7.35 ≤ 12 + log O/H ≤ 7.65 derived by the direct method (magenta filled triangles) and for galaxies with oxygen abundances derived by the semi-empirical method of Izotov & Thuan (2007; magenta open triangles). Three XMD candidates with 12 + logO/H ≤ 7.35 (this paper), denoted by large red filled circles and identified by the direct metallicity determination, are shown together with large red open circles representing sources with semi-empirical determinations. The total number of the LMG sample shown by magenta and red symbols is 287. We also show the XMD emission-line galaxies and candidates with 12 + log O/H ≤ 7.35 from Izotov & Thuan (2007), Izotov et al. (2012) and Guseva et al. (2015) by small blue circles. Well-known metal-deficient BCDs I Zw 18, SBS 0335–052W, and SBS 0335–052E are shown by filled blue triangles and are labelled in b). The extremely metal-poor dwarf galaxies Leo P (Skillman et al. 2013) and AGC 198691 (Hirschauer et al. 2016) are plotted respectively by a large open black square and large open black diamonds corresponding to three different distances. For comparison, the standard L–Z relation for emission-line galaxies (Izotov et al. 2006a; Izotov & Thuan 2007) is shown by black dots with the linear regression to these data (solid line). b) Extinction- and aperture-corrected Hβ luminosity-oxygen abundance relation. The samples and symbols are the same as in a). The black dots represent the SDSS galaxies from Izotov et al. (2006a), and all galaxies from Izotov & Thuan (2007) and Izotov et al. (2012). The black solid line denotes the linear regression to these data, excluding I Zw 18 and SBS 0335–052W. The filled green squares represent the high-redshift star-forming galaxies by Cullen et al. (2014). |
| In the text | |
|
Fig. 5 Stellar mass – oxygen abundance relation for the same samples as in Fig. 4 shown by the same symbols. For comparison, the SDSS DR7 emission-line galaxy sample from Izotov et al. (2014), where the errors of the [O iii]λ4363 emission-line fluxes do not exceed 25%, are shown by black dots with the linear likelihood regression for these data plotted by a solid black line. The location of high-redshift star-forming galaxies is shown by various large green symbols (see text). |
| In the text | |
|
Fig. 6 a) m(3.4 μm)–m(4.6 μm) vs. m(4.6 μm)–m(12 μm) colour–colour diagram for a sample of emission-line galaxies detected in the three WISE bands 3.4 μm (W1), 4.6 μm (W2), and 12 μm (W3). Galaxies with equivalent widths of the Hβ emission line EW(Hβ) ≥ 50Å and L(Hβ) ≥ 3 × 1040 erg s-1 are shown by filled red circles; galaxies with EW(Hβ) < 50Å and L(Hβ) < 3 × 1040 erg s-1 are depicted by open blue circles. The galaxy with m(3.4 μm)–m(4.6 μm) = 2.73 mag (J1353+1649) discovered here, is shown by a large black filled circle in all three panels. b) W1–W2 colour vs. oxygen abundance. The sample is split into two parts with high and low EW(Hβ). Nearby galaxies with redshifts less than 0.01 are presented by crosses (red for the galaxies with high EW(Hβ) and blue for low equivalent widths of Hβ). The remaining galaxies are presented by the same symbols as in a). c) W1–W2 vs. EW(Hβ) is shown for nearby galaxies (redshift z< 0.01, black crosses) and for more distant galaxies (z ≥ 0.01, filled magenta circles). |
| In the text | |
Current usage metrics show cumulative count of Article Views (full-text article views including HTML views, PDF and ePub downloads, according to the available data) and Abstracts Views on Vision4Press platform.
Data correspond to usage on the plateform after 2015. The current usage metrics is available 48-96 hours after online publication and is updated daily on week days.
Initial download of the metrics may take a while.