Fig. 6
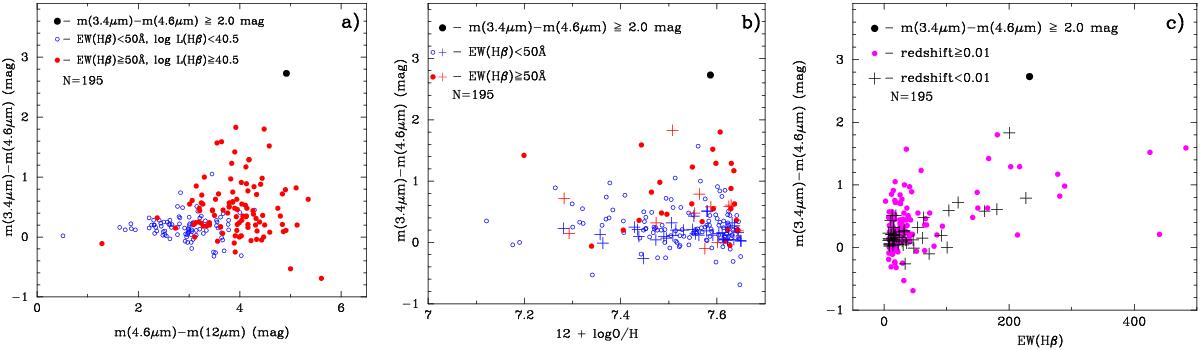
a) m(3.4 μm)–m(4.6 μm) vs. m(4.6 μm)–m(12 μm) colour–colour diagram for a sample of emission-line galaxies detected in the three WISE bands 3.4 μm (W1), 4.6 μm (W2), and 12 μm (W3). Galaxies with equivalent widths of the Hβ emission line EW(Hβ) ≥ 50Å and L(Hβ) ≥ 3 × 1040 erg s-1 are shown by filled red circles; galaxies with EW(Hβ) < 50Å and L(Hβ) < 3 × 1040 erg s-1 are depicted by open blue circles. The galaxy with m(3.4 μm)–m(4.6 μm) = 2.73 mag (J1353+1649) discovered here, is shown by a large black filled circle in all three panels. b) W1–W2 colour vs. oxygen abundance. The sample is split into two parts with high and low EW(Hβ). Nearby galaxies with redshifts less than 0.01 are presented by crosses (red for the galaxies with high EW(Hβ) and blue for low equivalent widths of Hβ). The remaining galaxies are presented by the same symbols as in a). c) W1–W2 vs. EW(Hβ) is shown for nearby galaxies (redshift z< 0.01, black crosses) and for more distant galaxies (z ≥ 0.01, filled magenta circles).

Current usage metrics show cumulative count of Article Views (full-text article views including HTML views, PDF and ePub downloads, according to the available data) and Abstracts Views on Vision4Press platform.
Data correspond to usage on the plateform after 2015. The current usage metrics is available 48-96 hours after online publication and is updated daily on week days.
Initial download of the metrics may take a while.