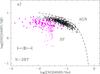
Fig. 2
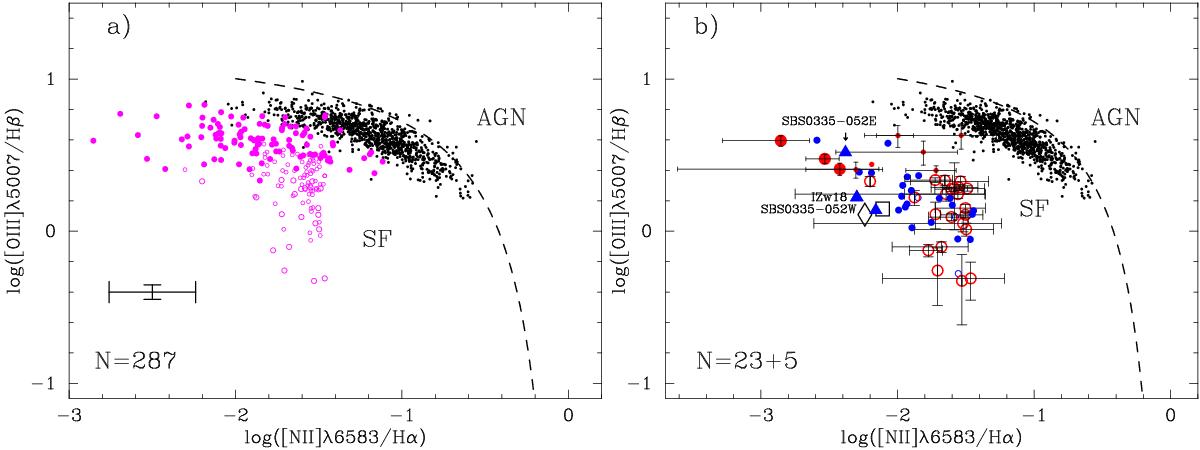
log([Oiii]λ5007/Hβ) vs. log([Nii]λ6583/Hα) diagnostic diagram (BPT, Baldwin et al. 1981). a) Low-metallicity candidates with 12 + log O/H ≤ 7.65. Magenta filled circles denote the galaxies with oxygen abundances derived using the direct method, and magenta open circles indicate galaxies with oxygen abundances derived with the semi-empirical method by Izotov & Thuan (2007). Error bars at the lower left corner represent the mean range of errors for individual galaxies. b) XMD candidates with 12 +log O/H ≤ 7.35. XMD candidates with metallicities derived by the direct and semi-empirical methods are denoted by red filled circles and red open circles, respectively. The galaxies with the [O iii]λ4363 Å emission lines detected at a level higher than 3σ are denoted by large red filled symbols and galaxies detected at 2–3σ levels by small red filled circles. We also show the XMD emission-line galaxies and candidates with 12 +log O/H ≤ 7.35 by Izotov & Thuan (2007), Izotov et al. (2012) and Guseva et al. (2015) by small blue circles. The well-known metal-deficient BCDs I Zw 18, SBS 0335–052W, and SBS 0335–052E are represented by filled blue triangles and are labelled. The extremely metal-poor dwarf galaxies Leo P (Skillman et al. 2013) and AGC 198691 (Hirschauer et al. 2016) are plotted by a large open black square and a large open black diamond, respectively. For comparison we also plot in a) and b) a sample of 803 luminous compact galaxies (LCGs, black dots, Izotov et al. 2011a). The dashed line from Kauffmann et al. (2003) separates star-forming galaxies (SF) from active galactic nuclei (AGN).
Current usage metrics show cumulative count of Article Views (full-text article views including HTML views, PDF and ePub downloads, according to the available data) and Abstracts Views on Vision4Press platform.
Data correspond to usage on the plateform after 2015. The current usage metrics is available 48-96 hours after online publication and is updated daily on week days.
Initial download of the metrics may take a while.