Fig. 4
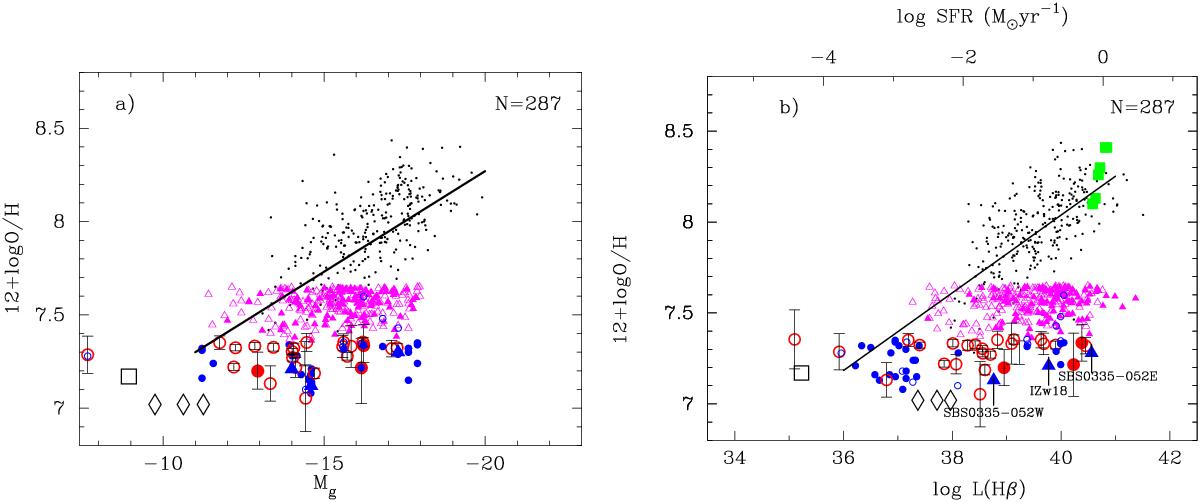
a) Absolute SDSS g magnitude-oxygen abundance relation for the galaxies with oxygen abundances 7.35 ≤ 12 + log O/H ≤ 7.65 derived by the direct method (magenta filled triangles) and for galaxies with oxygen abundances derived by the semi-empirical method of Izotov & Thuan (2007; magenta open triangles). Three XMD candidates with 12 + logO/H ≤ 7.35 (this paper), denoted by large red filled circles and identified by the direct metallicity determination, are shown together with large red open circles representing sources with semi-empirical determinations. The total number of the LMG sample shown by magenta and red symbols is 287. We also show the XMD emission-line galaxies and candidates with 12 + log O/H ≤ 7.35 from Izotov & Thuan (2007), Izotov et al. (2012) and Guseva et al. (2015) by small blue circles. Well-known metal-deficient BCDs I Zw 18, SBS 0335–052W, and SBS 0335–052E are shown by filled blue triangles and are labelled in b). The extremely metal-poor dwarf galaxies Leo P (Skillman et al. 2013) and AGC 198691 (Hirschauer et al. 2016) are plotted respectively by a large open black square and large open black diamonds corresponding to three different distances. For comparison, the standard L–Z relation for emission-line galaxies (Izotov et al. 2006a; Izotov & Thuan 2007) is shown by black dots with the linear regression to these data (solid line). b) Extinction- and aperture-corrected Hβ luminosity-oxygen abundance relation. The samples and symbols are the same as in a). The black dots represent the SDSS galaxies from Izotov et al. (2006a), and all galaxies from Izotov & Thuan (2007) and Izotov et al. (2012). The black solid line denotes the linear regression to these data, excluding I Zw 18 and SBS 0335–052W. The filled green squares represent the high-redshift star-forming galaxies by Cullen et al. (2014).
Current usage metrics show cumulative count of Article Views (full-text article views including HTML views, PDF and ePub downloads, according to the available data) and Abstracts Views on Vision4Press platform.
Data correspond to usage on the plateform after 2015. The current usage metrics is available 48-96 hours after online publication and is updated daily on week days.
Initial download of the metrics may take a while.