| Issue |
A&A
Volume 584, December 2015
|
|
|---|---|---|
| Article Number | A55 | |
| Number of page(s) | 7 | |
| Section | Astrophysical processes | |
| DOI | https://doi.org/10.1051/0004-6361/201527234 | |
| Published online | 19 November 2015 | |
On observing C60+ and C602+ in laboratory and space
Karlsruhe Institute of Technology, Institute of Physical Chemistry II, 76131 Karlsruhe, Germany
e-mail: This email address is being protected from spambots. You need JavaScript enabled to view it.
Received: 24 August 2015
Accepted: 18 October 2015
Abstract
Recently, we have measured the IR absorptions of C60+, C60−, and C602+ in neon matrixes. Many previously unknown absorptions were established. Here we compare our laboratory IR absorption spectra for C60+ and C602+ to the IR emission spectra of several astronomical objects that show C60 emission. We find that IR bands of C60+ are possibly present in the objects Tc1, SMP SMC 16, NGC 7023, NGC 2244, and SMP LMC 02. Infrared emission features possibly due to C602+ were identified in NGC 7023. To help with future observations of fullerene-related DIBs, we also revisited the oscillator strengths of the NIR absorptions of C60+, and report significantly revised values. Additionally, we report the UV oscillator strengths of C60+.
Key words: astrochemistry / molecular data / line: identification / methods: laboratory: molecular / planetary nebulae: general / infrared: planetary systems
© ESO, 2015
1. Introduction
The unequivocal detection of neutral fullerenes C60 and C70 in the planetary nebula Tc1 in 2010 (Cami et al. 2010) has rekindled interest in fullerenes in space. Fullerenes (primarily C60) have since been detected in several other astronomical objects (Otsuka et al. 2013; Iglesias-Groth & Esposito 2013; Sloan et al. 2014, and references therein). These observations are based on comparison of infrared (IR) emission data typically from space telescopes to laboratory IR absorption (Krätschmer et al. 1990) and high-temperature emission spectra (Nemes et al. 1994) extrapolated to lower temperatures.
Prior to the report by Cami et al. (2010), two diffuse interstellar bands (DIBs) at 958 and 963 nm had already been attributed to C (Foing & Ehrenfreund 1994) based on near-infrared (NIR) electronic absorption measurements in cryogenic matrixes (Fulara et al. 1993). However, this assignment was initially disputed (Maier 1994; Jenniskens et al. 1997; Misawa et al. 2009). More recently, the same DIBs were observed in the IRAS01005+7910 protoplanetary nebula (Iglesias-Groth & Esposito 2013), which also shows C60 IR emission features (Zhang & Kwok 2011). Laboratory measurements in gas phase (Campbell et al. 2015) have now conclusively shown that C is indeed the carrier of 958 and 963 nm DIBs.
We have recently built a setup for spectroscopy of ions in cryogenic inert gas matrixes and have used it to investigate C over a wider IR spectral range than before. Many unknown absorptions were uncovered (Kern et al. 2013). Furthermore, we have obtained first IR/NIR/UV spectra of C
 (Kern et al. 2014). A preliminary version of our data, containing parts of the C IR spectra, was presented at a conference in 2012 (Kern et al. 2012). On this basis, C was rapidly identified in both the Tc1 young planetary nebula (Strelnikov et al. 2012) and in the NGC 7023 reflection nebula (Berné et al. 2013). Here we revisit the IR identification of interstellar C now making use of the complete laboratory data set and comparing it to emission spectra from five astronomical objects showing C60 features. Additionally we provide new measurements, including cross sections of UV/NIR absorption features to help with future observations.
2. Experiment and observations
The IR and UV-NIR absorption spectra of C (Kern et al. 2013) and C (Kern et al. 2014) have been reported previously along with experimental procedures and data analysis methods. Briefly, samples were prepared through low-energy ion beam deposition into a cocondensed inert gas matrix doped with electron scavengers (CO2, CCl4) as necessary to vary the resulting fullerene charge state distributions. Two different electron scavengers were used to assure coverage of the full IR spectral region (free of overlap with electron scavenger absorptions). Here, we have extended these measurements to Ar matrixes.
We primarily compare the laboratory infrared spectra to astronomical data obtained from the Spitzer Heritage Archive: NGC 2244 (RA 06:31:48.05; Dec 04:19:36.6; AORKEY 25646080, 25646336; PI Jacqueline Keane), LMC02 (RA 04:40:56.78; Dec –67:48:01.2; AORKEY 4946944; PI James R. Houck), NGC 7023 (RA 21:01:41.95; Dec 68:09:50.7; AORKEY 23910912, 23911424; PI Kris Sellgren), SMC16 (RA 00:51:27.15; Dec –72:26:13.5; AORKEY 14706944; PI Letizia Stanghellini) and Tc1 (RA 17:45:35.08; Dec –46:05:22.7; AORKEY 11321600; PI Mathew Bobrowsky). Spectral data was extracted using the CUBISM program (Smith et al. 2007). The dust continuum background was subtracted as in Cami et al. (2010).
3. Results
3.1. Laboratory IR data
The experimental procedure and in particular the methods used to deconvolute the superimposed C absorption spectra have been described in detail in our previous work (Kern et al. 2013, 2014). IR frequencies of C60, C, and C
 absorptions in Ne and Ar matrixes are presented in Table 1 together with Ne data for C
 . Overview spectra for C60, C, and C can be found in Fig. 1. Since there are no gas-phase IR absorption or emission measurements for C
 so far, we estimate the low-temperature gas-phase absorption frequencies from the matrix data. It is known, that Gas-Ne matrix IR frequency shifts are in general smaller than Gas-Ar shifts (Jacox 1994). The primary reason is the lower polarizability of solid Ne and hence the weaker interaction of an oscillating dipole with its environment. In analogy to a damped oscillator, the Ne environment would have a lower damping coefficient in comparison to an Ar environment. If both Ne and Ar vibrational frequencies are close to each other – as is the case here – this implies that interaction with the matrix does not significantly influence an unperturbed vacuum vibration. Similar ideas were used to estimate the gas-phase electronic absorption frequency of C from frequencies of complexes C
 He, and CHe2 (Campbell et al. 2015). For C60 ions, only small changes of absorption frequencies occur upon switching from Ne to Ar. Therefore, gas phase absorptions of C at 5 K should be close to absorptions in matrix. Matrix absorption frequencies can be extrapolated to a gas-phase environment with zero polarizability (αGas = 0) by assuming νGas−νMatrix ~ αMatrix; see Table 1. For large molecules like fullerenes, matrix site effects should not significantly affect the vibrational potential surfaces.
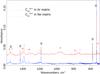 |
Fig. 1 Infrared spectra of C |
C absorption frequencies ν (in cm-1) in different environments, Ne, Ar matrixes, and gas phase at 5 K, and corresponding integrated molar absorptivity in Ne ANe (in km mol-1).
3.2. Laboratory UV-NIR data
Our data on NIR absorptions of C are very similar to Fulara et al. (1993) with the only difference being that the oscillator strengths are significantly larger. On the basis of integrated molar absorptivities previously measured for C in the IR region (Kern et al. 2013), the C NIR oscillator strengths are determined as f = 0.015 ± 0.005 for the 966 nm and f = 0.01 ± 0.003 for the 958 nm absorptions (see Fig. 2). It remains to be understood why the intensity ratio of the two strongest C NIR absorptions in Ne matrix (I966/I958 = 1.5) differs from the recently published (Campbell et al. 2015) gas-phase NIR spectrum of C He (I963/I958 = 0.8). The oscillator strength of the C absorption at 1058 nm is 0.022 ± 0.005.
C60, C, C and C all have very similar UV absorption features with minimal spectral shifts (Kern et al. 2014). Figure 3 shows corresponding UV-NIR spectra of two different C/C/C60 mixtures in Ne+1% CO2 (B) and Ne matrixes (A). We scaled spectra A and B to the same absorbance of neutral C60 in the characteristic 600 nm range and then subtracted spectrum A, with less C , from spectrum B, with much more C (CO2 electron scavenger doping prevents neutralization of soft-landed C). This procedure removes all C60 contributions such that essentially all absorption features remaining are due to C (an estimated amount of C is ≤4%). To obtain a C spectrum, one does not need information about the relative abundances of C in the samples. These compositions can however be estimated from known IR absorptivity data (Kern et al. 2013). Sample A contains approximately 74/13/13 of C/C/C60, while the relative ratio in the sample B is estimated to be about 24/72/4. In Fig. 3, strong C transitions at 322 and 960 nm are indicated with arrows. The oscillator strength of the 322 nm band, as calibrated against the 960 nm band, is 0.3 ± 0.15, which is close to the value of 0.37 for the corresponding C60 band (Sassara et al. 2001). Increasing light scattering further to the UV precludes estimating cross sections of higher energy C bands. Nevertheless, their intensities are comparable to those of C60.
3.3. Comparison to astronomical observations
Before comparing laboratory IR absorption to astronomical emission data one should first consider possible systematic differences in the peak positions and line intensities.
Frequencies. The matrix environment can influence IR frequencies inducing both blue- or redshifts relative to low temperature measurements in gas phase. Our Ne and Ar matrix data (Table 1) indicate that such shifts are small here. Bigger shifts could result from different vibrational excitation levels in gas phase vs. matrix. Nemes et al. (1994) observed that IR emission bands of C60 shift to lower frequencies with increasing temperature, reflecting anharmonicity. Correspondingly, the differences between matrix absorption and gas-phase emission frequencies increase. In fact, small redshifts of transitions at 7.0 and 8.5 μm have been observed in comparing laboratory and astronomical data (García-Hernández et al. 2010), especially for the 8.5 μm C60 emission. We do not expect significantly larger redshifts for C and, therefore, do not correct the laboratory frequencies.
Intensities. Two different approaches have been used to compare laboratory C60 IR absorption intensities to astronomical emission data: (i) modulation of line strengths to reflect thermal equilibrium with the surroundings (Cami et al. 2010); or (ii) simulation of IR emission for vibrationally excited species, as generated by UV absorption followed by radiationless relaxation into the ground electronic state (Sellgren et al. 2010). Qualitatively, for both approaches, the higher the emission temperatures the (relatively) weaker the long wavelength bands become. By contrast, a comparison of cryogenic matrix absorption with gas-phase emission data for pyrene cations illustrates that the associated effects may not always be large enough to require a correction (Kim & Saykally 2003)
With above caveats in mind, we have examined emission spectra of many astronomical objects in which C60 has been observed. In several cases we have found candidate features resembling C and C IR absorption spectral patterns.
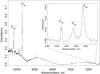 |
Fig. 2 Absorption spectrum obtained for a sample of Ne matrix isolated C |
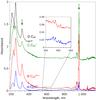 |
Fig. 3 UV-NIR absorption spectra recorded for matrixes with two different charge state ratios of C |
C. Figures 4 and 5 contrast IR emission spectra (5.2–11 μm, 11–35 μm) for the objects Tc1, SMP SMC 16, NGC 7023, NGC 2244, and SMP LMC 02 with laboratory IR absorption spectra in Ne matrix. A dust continuum background has been subtracted from the astronomical spectra as in Cami et al. (2010). The red dashed vertical lines with plus signs indicate possible features of C whereas blue dashed lines with double plus signs indicate possible features of C. We multiplied the absorbance of the C60 laboratory spectrum by a Planck distribution for T = 330 K and then scaled to the 17.4 and 18.9 μm bands of C60 in Tc1, following the procedure used by Cami et al. (2010).
A band at 6.48 μm is present in all astronomical spectra. This was previously assigned to a hydrogen recombination line by Cami et al. (2010), however, there is no such 6.48 μm line in the NIST atomic spectral database (NIST 2013) and no other published evidence for it. We suggest, therefore, that hydrogen is not responsible and instead assign the feature to the E1u(17) C infrared vibration. Sloan et al. (2014) also recently designated a 6.5 μm band observed in several Magellanic Cloud objects as fullerene related. The intensities of astronomical and laboratory spectra in the Figs. 4 and 5 were scaled to have comparable strengths at the purported 6.48 μm absorption/emission line of C for easier comparison of possible C features. The red dashed curve indicates the effect of applying the same 330 K intensity modulation to the unmodulated C spectrum (solid red line). The intensities of the modulated C spectrum have been scaled to fit the intensities of the unmodulated spectrum in the 5.2–11 μm region.
We searched for additional C features by comparing experimental and laboratory data sets further to the red. The band observed in the laboratory spectrum at about 7.11 μm (E1u(15) C) appears to be occluded by strong overlapping ArII and C60 neutral emissions, in particular, in the Tc1 spectrum. It can be better distinguished in the other objects in Fig. 4. The hydrogen recombination bands at 7.46 and 7.5 μm (NIST 2013) mask the C feature there. Referring next to Fig. 4, more or less pronounced emission features are always present in the vicinity of the 8.2 μm C band. The line at 10.45 μm (E1u(10) C) can be distinguished in the high-resolution SH data for Tc1 and, possibly, for NGC 2244. The line at about 12.8 μm (E1u(7) C) appears occluded by strong NeII emission. To longer wavelengths, the C IR absorption spectrum possesses two features at 17.4 and 18.9 μm that are not clearly resolvable from those of C60. Additionally, two characteristic C absorption bands are seen at 25.3 and 28.8 μm. The latter bands cannot be distinguished in the low-resolution LL data. However, a band at 28.9 μm in the high-resolution LH data of Tc1 may correspond to the E1u(1) C vibration. At the same time, there is no clear candidate for the 25.3 μm E1u(2) C band. An additional complication arises from interferences due to the IR detector of the IRAS instrument in this emission wavelength range. One way to overcome the problem of missing/unclear 25.3 and 28.8 μm C emissions is to assume that the relative intensities of these long wavelength bands are lowered by high emission temperatures.
 |
Fig. 4 IR emission Spitzer data of various astronomical objects vs. laboratory absorptions of C60 (black), C |
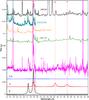 |
Fig. 5 IR emission Spitzer data of various astronomical objects vs. laboratory absorptions of C60 (black), C |
Fullerene and mixed spectra for several objects in the Magellanic Clouds (Sloan et al. 2014) show the 17.4 and 18.9 C60 bands with a wide range of intensity ratios. This was ascribed to superimposed 18.71 μm SIII emission, but it may instead reflect different relative contributions of the stronger 18.9 μm feature of C (see Fig. 5).
C . The laboratory IR absorption data obtained for C and C are similar in the short wavelength region. Nevertheless, the presence of C should be indentifiable by two characteristic emissions shifted somewhat to the blue and to the red of the C 6.48 and 7.11 features, respectively. The features at 6.42 and at 7.16 μm in the NGC 7023 object, and possibly also in NGC 2244 and SMP LMC 02 may correspond to C. Further C absorption features are either hidden by broad PAH emission bands or are too weak to be distinguished.
4. Discussion
4.1. Characteristic IR emission features
Infrared absorptions of C in Ne and Ar matrixes at 5 K are very similar and should therefore also be close to the low-temperature gas-phase absorption frequencies of C; see Sect. 3.1. By contrast, the absorption frequencies of C60, C C differ considerably, particularly in the 5.5–10 μm wavelength range. Thus, C60, C, and C should be distinguishable from one another on the basis of their gas-phase IR emission spectra.
A comparison of IR emission spectra of C60-containing objects with laboratory absorption data for C tentatively reveals the presence of C, and possibly also C, in the five astronomical objects. As they would likely be neutralized if embedded in dust particles, the cations must be isolated in gas phase. Another reason for invoking a gas-phase environment is the observation of IR emission bands. The main relaxation channel for large cationic species in gas phase would be IR emission, while for possibly embedded ions, relaxation would be expected to primarily proceed through phonon exchange with the environment: no fullerene specific IR emission features would be observed. Two mechanisms could be responsible for the ionization of C60: UV photoionization and/or cosmic-ray induced ionization. The first, second, and third ionization energies of C60 are 7.6 eV, 11.4 eV and 16.6 eV, respectively (Wörgötter et al. 1994). Further discussion on ionization mechanisms goes beyond the scope of this study.
Based on our preliminary laboratory IR absorption data, C had already been tentatively identified in NGC 7023 (“Position 2”) using IR emission lines observed at 6.43, 7.13, 8.1, and 10.53 μm (Berné et al. 2013). This differs only slightly from our preferred assignment of emission features observed at 6.48, 7.14, 8.2, and 10.45 μm to C on the basis of the complete laboratory data set and in comparison to observations for four more objects (Tc1, SMP SMC 16, NGC 2244, and SMP LMC 02). Nevertheless, these assignments remain tentative until higher resolution astronomical data become available in particular in the 5–10 μm region.
4.2. Relative abundances
Estimating C/C60 abundance ratios depends on assumptions concerning temperature-dependent modulations of infrared emission intensities. If a Planck’s law modulation with T = 330 K is applied to both C and C60 laboratory data sets (Cami et al. 2010), the Tc1 emission spectrum is best described by a C/C60 ratio of 1:10. A more qualitative way to estimate the abundance ratio C/C60 is to compare the intensities of the 8.5 and 7.0 μm C60 features with those of the 6.48 and 7.14 μm bands of C. As the relative strengths and positions of these bands are similar, modulation of IR emission intensities does not significantly influence the ratios. The SMP SMC 16 spectrum has a quite weak 8.5 μm C60 band and a weak 7.0 μm ArII/C60 band, whereas the rest of the spectrum is very similar to that of Tc1. Therefore most of the intensity flux at 6.48 and 7.14 μm and a considerable part of the 18.9 μm emission is due to C, i.e., C is more abundant than C60. Determination of fullerene charge state ratios in NGC 7023 and NGC 2244 is complicated by strong PAH emission features at 6.2 and 8.6 μm, which partially occlude the 6.48 μm C and 8.5 μm C60 bands. Nevertheless, given that the relative intensities of 6.48, 17.4, and 18.9 μm features are roughly similar in NGC 7023, NGC 2244, and SMP SMC 16, similar C/C60 ratios can be inferred. If C is present in NGC 7023 its abundance would be about 50% of that of C.
4.3. Fullerene related DIBs
The recent conclusive assignment of DIBs at 958 and 963 nm to NIR absorptions of C (Campbell et al. 2015) has already been mentioned. We find the corresponding oscillator strengths (f = 0.015 ± 0.005 for the 966 nm absorption and f = 0.01 ± 0.003 for the 958 nm absorption) to be significantly larger than previously reported. On the basis of our tentative identification of C in the IR emission of the objects considered here, we also recommend looking for their 958 and 963 nm DIBs. So far, C DIBs have only been seen in one C60 containing object, IRAS01005+7910, (Iglesias-Groth & Esposito 2013). However, this shows no clear IR signatures of C, as has been already pointed out (Dìaz-Luis et al. 2015).
C also has several strong UV absorptions (Fig. 3). Whereas NIR signatures are characteristic, and the UV absorptions of different fullerene charge states are calculated (and partly measured) to be quite similar, particularly when considering line broadening (Kern et al. 2014). Nevertheless, if NIR absorptions of C are present, then strong UV absorptions near 320 and 250 nm must also be detectable. Future work on fullerene related DIBs should also take the UV spectral region into account. So far, there has been no clear astronomical observation of C60 in the UV (Herbig 2000).
Concerning higher charge states, C has no strong NIR features, but C again has specific NIR absorptions in Ne at 899 and 857 nm (Kern et al. 2014). Based on the IR data of C and CCl3·Cl− counter-ion absorptions, we estimate the oscillator strengths of these two absorptions as f = 0.002 ± 0.001 and f = 0.0004 ± 0.0002, respectively. No other laboratory spectroscopic data for C exists so far. We recommend bands close to 899 and 857 nm as candidate bands for future astronomical surveys.
5. Conclusions
Infrared absorptions of C and C in inert gas matrixes have been compared to the IR emission spectra of several astronomical objects showing C60 emission. We find that C may be present in the objects Tc1, SMP SMC 16, NGC 7023, NGC 2244, SMP LMC02. In addition, C is possibly present in
NGC 7023. Higher resolution astronomical data in the 5–10 μm region would significantly improve the reliability of future IR observations of C .
.
To help with future observations of fullerene-related DIBs, we also revisited the oscillator strengths of the electronic NIR absorptions of C and report significantly revised laboratory values. We provide two candidate NIR bands for future astronomical surveys of C. Finally, we recommend that the UV region should also be considered in future astronomical observations of C .
.
Acknowledgments
This work was supported by the Deutsche Forschungsgemeinschaft (KA 972/10-1). We thank W. Krätschmer (Max-Planck Institute for Nuclear Physics) for helpful discussions.
References
- Berné, O., Mulas, G., & Joblin, C. 2013, A&A, 550, L4 [NASA ADS] [CrossRef] [EDP Sciences] [Google Scholar]
- Cami, J., Bernard-Salas, J., Peeters, E., & Malek, S. 2010, Science, 329, 1180 [NASA ADS] [CrossRef] [PubMed] [Google Scholar]
- Campbell, E. K., Holz, M., Gerlich, D., & Maier, J. P. 2015, Nature, 523, 322 [NASA ADS] [CrossRef] [PubMed] [Google Scholar]
- Dìaz-Luis, J. J., Garcìa-Hernàndez, D. A., Rao, N. K., Manchado, A., & Cataldo, F. 2015, A&A, 573, A97 [NASA ADS] [CrossRef] [EDP Sciences] [Google Scholar]
- Foing, B. H., & Ehrenfreund, P. 1994, Nature, 369, 296 [NASA ADS] [CrossRef] [Google Scholar]
- Fulara, J., Jakobi, M., & Maier, J. 1993, Chem. Phys. Lett., 211, 227 [NASA ADS] [CrossRef] [Google Scholar]
- García-Hernández, D., Manchado, A., García-Lario, P., et al. 2010, ApJ, 724, L39 [NASA ADS] [CrossRef] [Google Scholar]
- Herbig, G. H. 2000, ApJ, 542, 334 [NASA ADS] [CrossRef] [MathSciNet] [Google Scholar]
- Iglesias-Groth, S., & Esposito, M. 2013, ApJ, 776, L2 [NASA ADS] [CrossRef] [Google Scholar]
- Jacox, M. E. 1994, Chem. Phys., 189, 149 [NASA ADS] [CrossRef] [Google Scholar]
- Jenniskens, P., Mulas, G., Porceddu, I., & Benvenuti, P. 1997, A&A, 327, 337 [Google Scholar]
-
Kern, B., Strelnikov, D., Weis, P., Böttcher, A., & Kappes, M. M. 2012, C
 and C
and C in Neon Matrices and Argon Matrices, 68th Int. Symp. on Molecular Spectroscopy, https://molspect.chemistry.ohio-state.edu/symposium_67/symposium/Program/MJ.html#MJ08
[Google Scholar]
in Neon Matrices and Argon Matrices, 68th Int. Symp. on Molecular Spectroscopy, https://molspect.chemistry.ohio-state.edu/symposium_67/symposium/Program/MJ.html#MJ08
[Google Scholar]
- Kern, B., Strelnikov, D., Weis, P., Böttcher, A., & Kappes, M. M. 2013, J. Phys. Chem. A, 117, 8251 [CrossRef] [Google Scholar]
- Kern, B., Strelnikov, D., Weis, P., Böttcher, A., & Kappes, M. M. 2014, J. Phys. Chem. Lett., 457 [Google Scholar]
- Kim, H.-S., & Saykally, R. J. 2003, Rev. Sci. Instrum., 74, 2488 [NASA ADS] [CrossRef] [Google Scholar]
- Kramida, A., Ralchenko, Y., & Reader, J. 2014, NIST Atomic Spectra Database (version 5.1), Online, Available: http://physics.nist.gov/asd, National Institute of Standards and Technology, Gaithersburg, MD [Google Scholar]
- Krätschmer, W., Lamb, L., Fostiropoulos, K., & Huffman., D. 1990, Nature, 347, 354 [NASA ADS] [CrossRef] [Google Scholar]
- Maier, J. P. 1994, Nature, 370, 423 [NASA ADS] [CrossRef] [Google Scholar]
- Misawa, T., Gandhi, P., Hida, A., Tamagawa, T., & Yamaguchi, T. 2009, ApJ, 700, 1988 [NASA ADS] [CrossRef] [Google Scholar]
- Nemes, L., Ram, R. S., Bernath, P. F., et al. 1994, Chem. Phys. Lett., 218, 295 [NASA ADS] [CrossRef] [Google Scholar]
- Otsuka, M., Kemper, F., Hyung, S., et al. 2013, ApJ, 764, 77 [NASA ADS] [CrossRef] [Google Scholar]
- Sassara, A., Zerza, G., Chergui, M., & Leach, S. 2001, ApJS, 135, 263 [NASA ADS] [CrossRef] [Google Scholar]
- Sellgren, K., Werner, M. W., Ingalls, J. G., et al. 2010, ApJ, 722, L54 [NASA ADS] [CrossRef] [Google Scholar]
- Sloan, G. C., Lagadec, E., Zijlstra, A. A., et al. 2014, ApJ, 791, 28 [NASA ADS] [CrossRef] [Google Scholar]
- Smith, J. D. T., Armus, L., Dale, D. A., et al. 2007, PASP, 119, 1133 [NASA ADS] [CrossRef] [Google Scholar]
-
Strelnikov, D., Kern, B., Böttcher, A., & Kappes, M. M. 2012, Laboratory and Space Infrared Detection of C
 , PRAHA2012, the 22nd Int. Conf. on High Resolution Molecular Spectroscopy
[Google Scholar]
, PRAHA2012, the 22nd Int. Conf. on High Resolution Molecular Spectroscopy
[Google Scholar]
- Wörgötter, R., Dünser, B., Scheier, P., & Märk, T. D. 1994, J. Chem. Phys., 101, 8674 [NASA ADS] [CrossRef] [Google Scholar]
- Zhang, Y., & Kwok, S. 2011, ApJ, 730, 126 [NASA ADS] [CrossRef] [Google Scholar]
All Tables
C absorption frequencies ν (in cm-1) in different environments, Ne, Ar matrixes, and gas phase at 5 K, and corresponding integrated molar absorptivity in Ne ANe (in km mol-1).
All Figures
|
Fig. 1 Infrared spectra of C |
| In the text | |
|
Fig. 2 Absorption spectrum obtained for a sample of Ne matrix isolated C |
| In the text | |
|
Fig. 3 UV-NIR absorption spectra recorded for matrixes with two different charge state ratios of C |
| In the text | |
|
Fig. 4 IR emission Spitzer data of various astronomical objects vs. laboratory absorptions of C60 (black), C |
| In the text | |
|
Fig. 5 IR emission Spitzer data of various astronomical objects vs. laboratory absorptions of C60 (black), C |
| In the text | |
Current usage metrics show cumulative count of Article Views (full-text article views including HTML views, PDF and ePub downloads, according to the available data) and Abstracts Views on Vision4Press platform.
Data correspond to usage on the plateform after 2015. The current usage metrics is available 48-96 hours after online publication and is updated daily on week days.
Initial download of the metrics may take a while.