Fig. 3
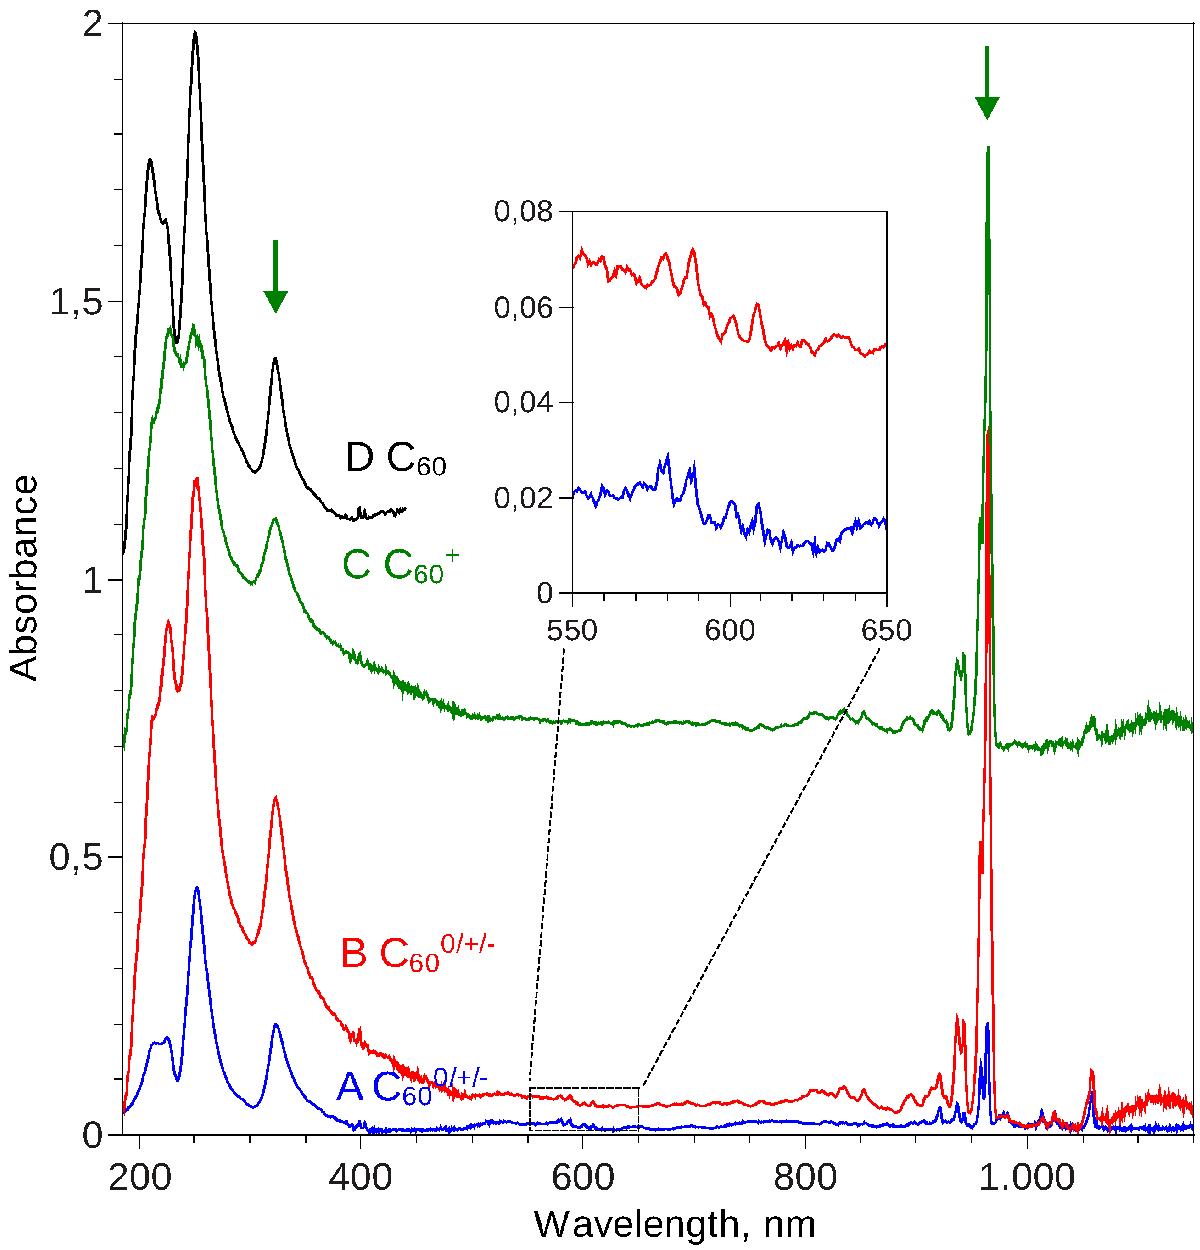
UV-NIR absorption spectra recorded for matrixes with two different charge state ratios of C![]() . A: C
. A: C![]() in Ne matrix. B: C
in Ne matrix. B: C![]() in Ne+1% CO2 matrix. B comprises much more C
in Ne+1% CO2 matrix. B comprises much more C![]() than A. The inset shows weak absorptions of C60. C shows the difference spectrum resulting from subtraction of A from B. D shows the reference UV spectrum of neutral C60 in Ne+1% CO2 matrix.
than A. The inset shows weak absorptions of C60. C shows the difference spectrum resulting from subtraction of A from B. D shows the reference UV spectrum of neutral C60 in Ne+1% CO2 matrix.
Current usage metrics show cumulative count of Article Views (full-text article views including HTML views, PDF and ePub downloads, according to the available data) and Abstracts Views on Vision4Press platform.
Data correspond to usage on the plateform after 2015. The current usage metrics is available 48-96 hours after online publication and is updated daily on week days.
Initial download of the metrics may take a while.