Fig. 2
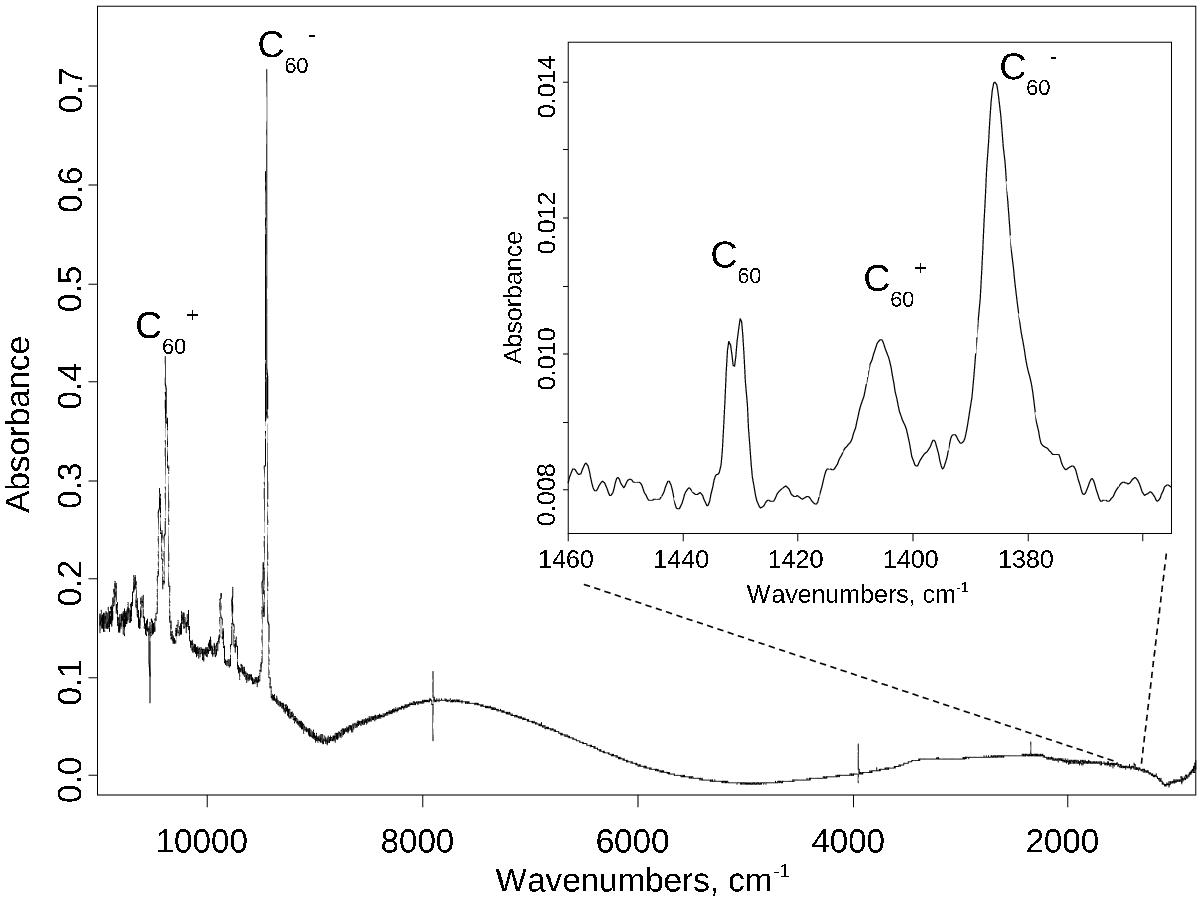
Absorption spectrum obtained for a sample of Ne matrix isolated C![]() over the complete NIR and IR spectral range using a halogen/Globar light source and a broadband MCT detector. Shown in the inset is a 60x expanded scale representation of a segment of the IR spectrum, containing absorption features assigned to C60, C
over the complete NIR and IR spectral range using a halogen/Globar light source and a broadband MCT detector. Shown in the inset is a 60x expanded scale representation of a segment of the IR spectrum, containing absorption features assigned to C60, C![]() and C
and C![]() , respectively.
, respectively.
Current usage metrics show cumulative count of Article Views (full-text article views including HTML views, PDF and ePub downloads, according to the available data) and Abstracts Views on Vision4Press platform.
Data correspond to usage on the plateform after 2015. The current usage metrics is available 48-96 hours after online publication and is updated daily on week days.
Initial download of the metrics may take a while.