| Issue |
A&A
Volume 568, August 2014
|
|
|---|---|---|
| Article Number | L5 | |
| Number of page(s) | 5 | |
| Section | Letters | |
| DOI | https://doi.org/10.1051/0004-6361/201424103 | |
| Published online | 14 August 2014 | |
The ALMA view of the protostellar system HH212⋆,⋆⋆
The wind, the cavity, and the disk
1 INAF, Osservatorio Astrofisico di Arcetri, Largo E. Fermi 5, 50125 Firenze, Italy
e-mail: This email address is being protected from spambots. You need JavaScript enabled to view it.
2 LERMA, UMR 8112 du CNRS, Observatoire de Paris, École Normale Supérieure, 61 Av. de l’Observatoire, 75014 Paris, France
3 UJF-Grenoble1/CNRS-INSU, Institut de Planétologie et d’Astrophysique de Grenoble (IPAG) UMR 5274, 38041 Grenoble, France
4 IRAM, 300 rue de la Piscine, 38406 Saint Martin d’Hères, France
5 Max-Planck-Institut für Radioastronomie, Auf dem Hügel 69, 53121 Bonn, Germany
6 IGN, Observatorio Astronómico Nacional, Alfonso XIII 3, 28014 Madrid, Spain
7 INAF, Osservatorio Astronomico di Roma, via di Frascati 33, 00040 Monte Porzio Catone, Italy
Received: 30 April 2014
Accepted: 22 July 2014
Abstract
Context. Because it is viewed simply edge-on, the HH212 protostellar system is an ideal laboratory for studying the interplay of infall, outflow, and rotation in the earliest stages of low-mass star formation.
Aims. We wish to exploit the unmatched combination of high angular resolution, high sensitivity, high-imaging fidelity, and spectral coverage provided by ALMA to shed light on the complex kinematics of the innermost central regions of HH212.
Methods. We mapped the inner 10″ (4500 AU) of the HH212 system at ≃0.5″ resolution in several molecular tracers and in the 850 μm dust continuum using the ALMA interferometer in band 7 in the extended configuration of the Early Science Cycle 0 operations.
Results. Within a single ALMA spectral set-up, we simultaneously identify all the crucial ingredients known to be involved in the star formation recipe: (i) the fast, collimated bipolar SiO jet driven by the protostar; (ii) the large-scale swept-up CO outflow; (iii) the flattened rotating and infalling envelope, with bipolar cavities carved by the outflow (in C17O(3–2)); and (iv) a rotating wide-angle flow that fills the cavities and surrounds the axial jet (in C34S(7–6)). In addition, the compact high-velocity C17O emission (±1.9−3.5 km s-1 from systemic) shows a velocity gradient along the equatorial plane consistent with a rotating disk of ≃ AU around a ≃0.3 ± 0.1 M⊙ source. The rotating disk is possibly Keplerian.
Conclusions. HH212 is the third Class 0 protostar with possible signatures of a Keplerian disk of radius ≥30 AU. The warped geometry in our CS data suggests that this large Keplerian disk might result from misaligned magnetic and rotation axes during the collapse phase. The wide-angle CS flow suggests that disk winds may be present in this source.
Key words: stars: formation / ISM: jets and outflows / ISM: molecules / ISM: individual objects: HH212
Appendix A is available in electronic form at http://www.aanda.org
Final reduced ALMA cubes (FITS) are only available at the CDS via anonymous ftp to cdsarc.u-strasbg.fr (130.79.128.5) or via http://cdsarc.u-strasbg.fr/viz-bin/qcat?J/A+A/568/L5
© ESO, 2014
1. Introduction
Jets from young accreting stars remain one of the most spectacular and enigmatic phenomena in astrophysics. Although their exact launch zone is still debated, it is currently accepted that they are powered by the rotation and accretion energy of the system, and are accelerated or collimated via a magneto-hydrodynamical (MHD) process (see e.g. Ferreira et al. 2006; Shang et al. 2007; Pudritz et al. 2007, and references therein). MHD-driven jets could play a crucial role during the earliest Class 0 phase, that is, in the star and disk formation process itself. High-resolution MHD simulations of protostellar collapse with typical amounts of rotation and magnetisation show that MHD outflows are an unavoidable outcome, and are able to eject 20% to 50% of the infalling core gas before it reaches the central source (e.g. Ciardi & Hennebelle 2010). Hence this initial phase of massive MHD ejection may be a key agent that can limit the final stellar mass and explain the low (≃30%) core-to-star efficiency suggested from a comparison of the initial mass function with the prestellar core mass function (e.g. André et al. 2007). However, the same simulations show that magnetic braking by the outflows and twisted B-fields is so efficient when the field and the spin axis Ω are aligned that Keplerian disks may be initially suppressed beyond 10 AU (e.g. Price & Bate 2007; Machida et al. 2011). This is the so-called magnetic-braking catastrophe. On the other hand, much larger Keplerian disks of 100−150 AU have previously been reported in two Class 0 sources (L1527 and VLA1623; Tobin et al. 2010; Murillo et al. 2013). Such large Keplerian disks might result from misaligned B − Ω configurations or a strong turbulence (Joos et al. 2012, 2013), but observational evidence is still lacking. A detailed observation and characterisation of a larger sample of Class 0 infall–outflow systems is thus essential to elucidate the disk formation process, and to clarify the role of jets and outflows in removing angular momentum from the system and regulating the final stellar mass.
HH212 is a strikingly bright and symmetric bipolar jet from a Class 0 source in Orion (at 450 pc) that was first revealed in H2 imaging (Zinnecker et al. 1998). Its innermost regions have been extensively studied in CO(2−1), (3−2) and SiO(2−1), (5−4), (8−7) withf the SMA and IRAM PdBI at scales ranging from ≃1′′−2.5′′ (Lee et al. 2006, 2007) to ≃0.3′′−0.4′′ (Codella et al. 2007; Lee et al. 2008; Cabrit et al. 2007, 2012). These maps revealed a bright bipolar SiO microjet with inner peaks at ±1 − 2′′ = 450 − 900 AU of the protostar, invisible in H2 due to high extinction (Codella et al. 2007; Lee et al. 2007). The SiO jet width ≃100 AU is remarkably close to atomic jet widths in T Tauri stars, favouring a universal MHD collimation process (Cabrit et al. 2007). Interestingly, a flattened rotating envelope in the equator perpendicular to the jet axis was observed in NH3 with a radius of ~7000 AU by Wiseman et al. (2001). Subsequent observations in C18O and 13CO with the SubMillimeter Array, and in HCO+ with the Atacama Large Millimeter Array (ALMA) suggest that the rotating envelope inside a radius ~1000 AU is in free-fall onto a source of mass ≃0.2 M⊙ while conserving angular momentum (Lee et al. 2006, 2014). The dust continuum imaged by ALMA is flattened perpendicular to the jet and suggestive of a disk of (maximum) radius ≃0.3 AU (Lee et al. 2014). All these findings make HH212 an ideal laboratory for investigating the interplay of infall, outflow and rotation in the earliest stages of the low-mass star-forming process.
2. Observations
HH212 was observed with ALMA using 24 12m antennas on 2012 December 1 during the Early Science Cycle 0 phase. The shortest and longest baselines were about 20 m and 360 m, from which we obtained a maximum unfiltred scale of 3″ at 850 μm. The C17O(3–2), SiO(8–7), and C34S(7–6) lines1 at 337 061.13 MHz, 347 330.63 MHz, and 337 396.69 MHz, respectively, were observed using spectral units of 488 kHz (0.43 km s-1) resolution. Calibration was carried out following standard procedures, using quasars J0538−440, J0607−085, as well as Callisto and Ganymede. Spectral line imaging was achieved with the CASA package. Data analysis was performed using the GILDAS2 package. Images have a typical clean-beam FWHM of  (PA = 35°), and an rms noise of ~1 mJy beam-1 for continuum, and 3−4 mJy beam-1 in the 0.44 km s-1 channels. Positions are given with respect to the MM1 protostar, located at
  ,
,  , in excellent agreement with the coordinates derived by Lee et al. (2014) using ALMA.
3. Line results and analysis
Figure 1 compares the emission maps in the 850 μm continuum, SiO(8–7), C17O(3–2), and C34S(7–6). The combination of these tracers allows us to simultaneously image in a single ALMA spectral set-up different ingredients of the star formation process: (i) a pair of narrow SiO jets launched from the protostar (dust peak); (ii) an extended flattened C17O envelope around the outflow waist; and (iii) biconical C34S emission lobes surrounding the jet. The first feature is well-known characteristics of some Class 0 sources (see e.g. Tafalla et al. 2010, and references therein). A full analysis of the new details detected up by ALMA will be presented in a later publication. Here, we focus on the latter two features, which were imaged here with unprecedented fidelity and signal-to-noise.
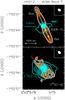 |
Fig. 1 Protostellar system HH212 as observed by ALMA Cycle 0 in band 7. Upper panel: 850 μm continuum (turquoise contours) overlaid on SiO(8–7) integrated between –23 and +15 km s-1 (colour scale and black contours), compared with the systemic velocity Vsys (see text). First contours at 5σ (6 mJy beam-1 for continuum and 270 mJy beam-1 km s-1 for SiO) in steps of 20σ (continuum) and 5σ (SiO). The ellipse shows the synthesised continuum HPBW ( |


3.1. Systemic velocity
The channel maps for C17O(3–2) and C34S(7–6) are reported in Figs. A.1 and A.2. There is no missing flux feature or P Cygni absorption near systemic velocity, in contrast to previous SMA data in the more abundant 13CO and C18O molecules and ALMA data in HCO+ (Lee et al. 2006, 2014). The spatial distributions clearly indicate that the velocity where emission is most spatially extended and thus presumably closest to the systemic velocity is in the [+0.91,+1.34] km s-1 channel for C17O, and in the [+1.23,+1.69] km s-1 channel for C34S (bottom-right panels of Figs. A.1 and A.2). These are also the channels for which the other channel maps show the best blue/red morphological symmetry. From combining these findings, and considering our spectral resolution of ~0.43 km s-1, the systemic velocity Vsys, as indicated by C17O and C34S, has to be close to ≃ +1.3 ± 0.2 km s-1. This value is clearly supported by the position–velocity (PV) diagram of the C17O(3–2) emission perpendicular to the jet axis (PA = 112°), see Figs. 2a,b, which shows that the emission is most extended and most symmetric about Vsys = + 1.3 km s-1. This value is slightly different from the +1.6 km s-1 measured using NH3(1, 1) VLA emission by Wiseman et al. (2001). This could reflect the different spatial scales, as the ammonia core observed by Wiseman et al. (2001) has a FWHM ~ 14 000 AU and probably traces the motion in the outer layers of the molecular envelope. We adopt Vsys = + 1.3 km s-1 in the remainder of this paper.
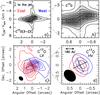 |
Fig. 2 Panel a): position–velocity (PV) cut of C17O(3–2) perpendicular to the jet. First contour at 5σ (0.30 K) and steps of 20σ. Dashed lines mark Vsys = + 1.3 km s-1 and the continuum peak MM1. Panelb): zoom-in of the C17O(3–2) PV plot. Panelc): blue- and redshifted C17O(3–2) emission in the LV range (±0.6–1.5 km s-1 from Vsys), tracing the rotating outflow cavity. The tilted black cross indicates the SiO jet direction (PA = 22°) and the equatorial plane. First contour at 5σ (15 mJy beam-1 km s-1), then steps of 7σ. Panel d): same as panel c) for the HV velocity range (±1.9–3.5 km s-1 from systemic), tracing the rotating inner disk. Note the smaller spatial scale in panels b) and d). |
3.2. C17O(3–2): rotating envelope cavities and inner disk
Figure 2ab shows that, in addition to infall motions (traced by the extended diamond shape of the PV at low contour levels), a rotation signature is clearly seen in the form of two emission peaks at low velocities ≤1.5 km s-1 (referred to as LV in the following): one blueshifted to the west, and one redshifted to the east. Figure 2c shows that this rotating LV C17O emission is (mainly) tracing the sides of the southern cavity carved by the outflow into the envelope. The sides are rotating in the same sense as the NH3, C18O, and HCO+ cores (Wiseman et al. 2001; Lee et al. 2006, 2014), that is with blueshifted gas in the west and redshifted gas in the east, as expected for envelope material swept-up and compressed by the outflow.
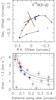 |
Fig. 3 Upper panel: distribution of the C17O(3–2) centroid positions (from fits in the uv domain with 1σ error bars) in the various velocity channels (Fig. A.1). Red and blue datapoints denote the channels whose fitted centroids lie, within the error bars, on the equator. Bottom panel: velocity shift from Vsys as a function of distance from the protostar along the equator (PA = 122°). Red and blue datapoints denote the channels whose fitted centroids lie along the equator (see upper panel). The assumed systemic velocity is +1.3 km s-1 (see text). Grey points refer to LV emission tracing the C17O envelope and cavity. Black solid and dotted curves show Keplerian rotation around a stellar mass of 0.3 ± 0.1 M⊙. The r-1 curve for angular momentum conservation is plotted in magenta for comparison. |
Figure 2d shows that at higher velocities ≃1.9−3.5 km s-1 from systemic (denoted as HV in the following): (i) the E-W velocity gradient is still present; and (ii) the emission is definitely more compact (≤ ). Similarly to other Class 0 disk studies (see e.g. Murillo et al. 2013, and references therein), the emission centroid positions in each channel were obtained from elliptical Gaussian fits in the uv domain3. The results are plotted in Fig. 3. While the centroids in the LV range fall on the southern cavity, as expected from the channel maps, the centroids in the HV range move to the equatorial plane (within the uncertainties), which indicates an inner rotating equatorial disk of radius ≃
 (90 AU). These findings are consistent with the outer radius of the flattened continuum disk imaged by Lee et al. (2014), who derived 120 AU using their ALMA map at 350 GHz.
We compare in Fig. 3 the centroid measurements along the disk plane with Keplerian rotation curves and, as a reference, with a ~ r-1 rotation curve that conserves specific angular momentum (pseudo-disk). Although a ~ r-1 trend is not ruled out, Fig. 3 shows that the present measurements are consistent with Keplerian rotation out to  AU around a 0.3 ± 0.1 M⊙ protostar. This mass estimate agrees with the 0.2 M⊙ derived by Lee et al. (2006, 2014) from modelling the rotating infall kinematics of C13O, C18O, and HCO+ on larger scales4 All these findings support the hypothesis of a rotating disk of radius 90 AU around the MM1 protostar, possibly in Keplerian rotation inside this radius.
3.3. C34S: warped cavity and wide-angle flow
While the bulk of the C17O emission in Fig. 1 (Middle) is tracing the protostellar envelope of FWHM ≃ 460 AU flattened in the equatorial plane, C34S is elongated along the outflow, with little emission in the equatorial plane. Given the high critical density of the C34S(7–6) line (~ 9 × 106 cm-3 between 10 K and 300 K, according to the collisional rates of Lique et al. 2006), and the envelope density inferred by Lee et al (2014), this suggests that CS is tracing a dense gas component more closely related to the primary jet or outflow. Near systemic velocity, C34S is imaging a biconical structure surrounding the SiO jet and with MM1 at the vertex (see Fig. 4). A surprising finding is the S-shaped warp seen in C34S, despite the very straight axial jet. Similar cavity asymmetries are predicted by MHD simulations during protostellar collapse with a misaligned magnetic field and angular momentum vectors (e.g. Ciardi & Hennebelle 2010); hence the C34S warp might be a remnant imprint of this initial configuration, which has been invoked to explain the formation of large Keplerian disks in Class 0 sources (Joos et al. 2012). Sensitive polarisation measurements with ALMA will be crucial to test this hypothesis.
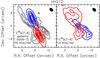 |
Fig. 4 Left: SiO(8–7) channel maps at Vsys ± 8 km s-1 (blue and red) overlaid on top of C34S(7–6) close to systemic velocity (black). Right: C34S(7–6) channel maps at low blue and redshifted velocities ~ Vsys ± 0.9 km s-1, showing a rotating wide-angle flow about the jet axis. SiO first contour at 5σ (25 mJy beam-1 km s-1) and steps of 25σ. C34S first contours and steps correspond to 5σ (15 mJy beam-1 km s-1). |
Figure 4 further indicates that the C34S southern lobe is clearly rotating about the jet in the same sense as the C17O cavity. However, Fig. A.2 shows that the structure of C34S is narrower than that of C17O and becomes gradually more collimated towards the jet axis as the velocity increases, changing progressively from a biconical morphology near Vsys to a jet at VLSR − Vsys ≥ 2.5 km s-1. This suggests that the C34S emission may be filling-in the swept-up extended cavity delineated by C17O, and trace a rotating wide-angle flow with a nested onion-like velocity structure, highly reminiscent of that seen in the atomic jet from the T Tauri star DG Tau (Bacciotti et al. 2002).
4. Conclusions
C17O traces three different components that depend on the velocity of its emission: the infalling envelope near systemic velocity, the rotating cavity in the LV range, and a rotating equatorial disk in the HV range with radius ~0.̋2 = 90 AU, which may be Keplerian around a protostar of 0.3 ± 0.1 M⊙. On the other hand, the wide-angle CS flow suggests that disk winds may be present in this source. The present results calls for more observations at high spatial and spectral resolutions of disk tracers to confirm the disk size and verify its Keplerian nature.
Online material
Appendix A: C17O, C34S, and CH3OH kinematics
We report in Figs. A.1 and A.2 the channel maps of the C17O(3–2) and C34S(7–6) (continuum-subtracted) emissions towards HH212 that were analysed and discussed in the main text.
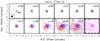 |
Fig. A.1 Channel maps of the C17O(3–2) (continuum-subtracted) emissions towards HH212. The bottom-right panel shows in magenta the 0.43 km s-1 wide channel (centred on +1.13 km s-1) where emission is most spatially extended. The other panels superposed in blue and red contours are the channel maps at symmetric blue/red velocity offsets from this central channel, with the velocity shift given (in km s-1) in the upper-right corner. The black cross (inclined to show the SiO jet direction) indicates the position of the MM1 continuum source. The ellipse in the top-left panel shows the ALMA synthesised beam (HPBW): |
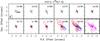 |
Fig. A.2 Channel maps of the C34S(7–6) blue- and redshifted (continuum-subtracted) emissions towards HH212. The bottom-right panel shows in magenta the 0.43 km s-1 wide channel (centred on +1.42 km s-1) where emission is the most spatially extended. The other panels superposed in blue and red contours are the channel maps at symmetric blue and red velocity offsets from this central channel, with the velocity shift given (in km s-1) in the upper-right corner. Symbols are the same as in Fig. A.1. First contours and steps correspond to 5σ (15 mJy beam-1 km s-1). |
We used the GILDAS uv − fit task: the resulting error on centroid position is the function of the channel signal-to-noise ratio and atmospheric seeing, and is typically much smaller than the beam size.
Acknowledgments
We are grateful to D. Galli for helpful discussions and suggestions. This paper makes use of the following ALMA data: ADS/JAO.ALMA#2011.0.000647.S (PI: C. Codella). ALMA is a partnership of ESO (representing its member states), NSF (USA) and NINS (Japan), together with NRC (Canada) and NSC and ASIAA (Taiwan), in cooperation with the Republic of Chile. The Joint ALMA Observatory is operated by ESO, AUI/NRAO and NAOJ. This work was partly supported by the PRIN INAF 2012 – JEDI and by the Italian Ministero dell’Istruzione, Università e Ricerca through the grant Progetti Premiali 2012 – iALMA. L.P. has received funding from the European Union Seventh Framework Programme (FP7/2007-2013) under grant agreement No. 267251.
References
- André, Ph., Belloche, A., Motte, F., & Peretto, N. 2007, A&A, 472, 519 [NASA ADS] [CrossRef] [EDP Sciences] [Google Scholar]
- Bacciotti, F., Ray, T. P., Mundt, R., Eislöffel, J., & Solf, J. 2002 ApJ, 576, 222 [Google Scholar]
- Cabrit, S., Ferreira, J., & Raga, A. C. 1999, A&A, 343, L61 [Google Scholar]
- Cabrit, S., Codella, C., Gueth, F., et al. 2007, A&A, 468, L29 [NASA ADS] [CrossRef] [EDP Sciences] [Google Scholar]
- Cabrit, S., Codella, C., Gueth, F., & Gusdorf, A. 2012, A&A, 548, L2 [NASA ADS] [CrossRef] [EDP Sciences] [Google Scholar]
- Ciardi, A., & Hennebelle, P. 2010, A&A, 409, L39 [Google Scholar]
- Claussen, M. J., Marvel, K. B., Wootten, A., & Wilking, B. A. 1998, ApJ, 507, L79 [NASA ADS] [CrossRef] [Google Scholar]
- Codella, C., Cabrit, S., Gueth, F., et al. 2007, A&A, 462, L53 [NASA ADS] [CrossRef] [EDP Sciences] [Google Scholar]
- Ferreira, J., Dougados, C., & Cabrit, S. 2006, A&A, 453, 785 [NASA ADS] [CrossRef] [EDP Sciences] [Google Scholar]
- Joos, M., Hennebelle, P., & Ciardi, A. 2012, A&A, 543, A128 [NASA ADS] [CrossRef] [EDP Sciences] [Google Scholar]
- Joos, M., Hennebelle, P., Ciardi, A., & Fromang, S. 2013, A&A, 554, A17 [NASA ADS] [CrossRef] [EDP Sciences] [Google Scholar]
- Lee, C.-F., Ho, P. T. P., Beuther, H., et al. 2006, ApJ, 639, L292 [NASA ADS] [CrossRef] [Google Scholar]
- Lee, C.-F., Ho, P. T. P., Hirano, N., et al. 2007, ApJ, 659, L499 [NASA ADS] [CrossRef] [Google Scholar]
- Lee, C.-F., Ho, P. T. P., Bourke, T. L., et al. 2008, ApJ, 685, 1026 [NASA ADS] [CrossRef] [Google Scholar]
- Lee, C.-F., Hirano, N., Zhang, Q., et al. 2014, ApJ, 786, 114 [NASA ADS] [CrossRef] [Google Scholar]
- Lique, F., Spielfiedel, A., & Cernicharo, J. 2006, A&A, 451, 1125 [NASA ADS] [CrossRef] [EDP Sciences] [Google Scholar]
- Machida, M. N., Inutsuka, S.-I., & Matsumoto, T. 2011, PASJ, 63, 555 [NASA ADS] [CrossRef] [Google Scholar]
- Müller, H. S. P., Schöier, F. L., Stutzki, J., & Winnewisser, G. 2005, J. Mol. Struct., 742, 215 [NASA ADS] [CrossRef] [Google Scholar]
- Murillo, N. M., Lai, S.-P., Bruderer, S., Harsolo, D., & van Dishoeck, E. F. 2013, A&A, 560, A103 [NASA ADS] [CrossRef] [EDP Sciences] [Google Scholar]
- Pickett, H. M., Poynter, R. L., Cohen, E. A., et al. 1998, J. Quant. Spectr. Radiat. Transf., 60, 883 [Google Scholar]
- Price, D. J., & Bate, M. 2007, Ap&SS, 311, 75 [NASA ADS] [CrossRef] [Google Scholar]
- Pudritz, R. E., Ouyed, R., Fendt Ch., & Brandenburg, A. 2007, in Protostars and Planets V (Tucson: University of Arizona Press ), 277 [Google Scholar]
- Sakai, N., Sakai, T., Hirota, T., et al. 2014, Nature, 507, 78 [NASA ADS] [CrossRef] [Google Scholar]
- Shang, H., Li, Z.-Y., & Hirano, N. 2007, in Protostars and Planets V (Tucson: University of Arizona Press), 261 [Google Scholar]
- Stahler, S., Korycansky, D. G., Brothers, M. J., et al. 1994, ApJ, 431, 341 [NASA ADS] [CrossRef] [Google Scholar]
- Tafalla, M., Santiago-García, J., Hacar, A., & Bachiller, R. 2010, A&A, 521, A91 [CrossRef] [EDP Sciences] [Google Scholar]
- Tobin, J., Hartmann, L., Looney, L. W., & Chiang, H.-F. 2010, ApJ, 712, 1010 [NASA ADS] [CrossRef] [Google Scholar]
- Wiseman, J., Wootten, A., Zinnecker, H., & McCaoughrean, M. 2001, ApJ, 550, L87 [NASA ADS] [CrossRef] [Google Scholar]
- Zinnecker, H., McCaughrean, M. J., & Rayner, J. T. 1998, Nature, 394, 862 [NASA ADS] [CrossRef] [PubMed] [Google Scholar]
All Figures
|
Fig. 1 Protostellar system HH212 as observed by ALMA Cycle 0 in band 7. Upper panel: 850 μm continuum (turquoise contours) overlaid on SiO(8–7) integrated between –23 and +15 km s-1 (colour scale and black contours), compared with the systemic velocity Vsys (see text). First contours at 5σ (6 mJy beam-1 for continuum and 270 mJy beam-1 km s-1 for SiO) in steps of 20σ (continuum) and 5σ (SiO). The ellipse shows the synthesised continuum HPBW ( |
| In the text | |
|
Fig. 2 Panel a): position–velocity (PV) cut of C17O(3–2) perpendicular to the jet. First contour at 5σ (0.30 K) and steps of 20σ. Dashed lines mark Vsys = + 1.3 km s-1 and the continuum peak MM1. Panelb): zoom-in of the C17O(3–2) PV plot. Panelc): blue- and redshifted C17O(3–2) emission in the LV range (±0.6–1.5 km s-1 from Vsys), tracing the rotating outflow cavity. The tilted black cross indicates the SiO jet direction (PA = 22°) and the equatorial plane. First contour at 5σ (15 mJy beam-1 km s-1), then steps of 7σ. Panel d): same as panel c) for the HV velocity range (±1.9–3.5 km s-1 from systemic), tracing the rotating inner disk. Note the smaller spatial scale in panels b) and d). |
| In the text | |
|
Fig. 3 Upper panel: distribution of the C17O(3–2) centroid positions (from fits in the uv domain with 1σ error bars) in the various velocity channels (Fig. A.1). Red and blue datapoints denote the channels whose fitted centroids lie, within the error bars, on the equator. Bottom panel: velocity shift from Vsys as a function of distance from the protostar along the equator (PA = 122°). Red and blue datapoints denote the channels whose fitted centroids lie along the equator (see upper panel). The assumed systemic velocity is +1.3 km s-1 (see text). Grey points refer to LV emission tracing the C17O envelope and cavity. Black solid and dotted curves show Keplerian rotation around a stellar mass of 0.3 ± 0.1 M⊙. The r-1 curve for angular momentum conservation is plotted in magenta for comparison. |
| In the text | |
|
Fig. 4 Left: SiO(8–7) channel maps at Vsys ± 8 km s-1 (blue and red) overlaid on top of C34S(7–6) close to systemic velocity (black). Right: C34S(7–6) channel maps at low blue and redshifted velocities ~ Vsys ± 0.9 km s-1, showing a rotating wide-angle flow about the jet axis. SiO first contour at 5σ (25 mJy beam-1 km s-1) and steps of 25σ. C34S first contours and steps correspond to 5σ (15 mJy beam-1 km s-1). |
| In the text | |
|
Fig. A.1 Channel maps of the C17O(3–2) (continuum-subtracted) emissions towards HH212. The bottom-right panel shows in magenta the 0.43 km s-1 wide channel (centred on +1.13 km s-1) where emission is most spatially extended. The other panels superposed in blue and red contours are the channel maps at symmetric blue/red velocity offsets from this central channel, with the velocity shift given (in km s-1) in the upper-right corner. The black cross (inclined to show the SiO jet direction) indicates the position of the MM1 continuum source. The ellipse in the top-left panel shows the ALMA synthesised beam (HPBW): |
| In the text | |
|
Fig. A.2 Channel maps of the C34S(7–6) blue- and redshifted (continuum-subtracted) emissions towards HH212. The bottom-right panel shows in magenta the 0.43 km s-1 wide channel (centred on +1.42 km s-1) where emission is the most spatially extended. The other panels superposed in blue and red contours are the channel maps at symmetric blue and red velocity offsets from this central channel, with the velocity shift given (in km s-1) in the upper-right corner. Symbols are the same as in Fig. A.1. First contours and steps correspond to 5σ (15 mJy beam-1 km s-1). |
| In the text | |
Current usage metrics show cumulative count of Article Views (full-text article views including HTML views, PDF and ePub downloads, according to the available data) and Abstracts Views on Vision4Press platform.
Data correspond to usage on the plateform after 2015. The current usage metrics is available 48-96 hours after online publication and is updated daily on week days.
Initial download of the metrics may take a while.