Fig. 3
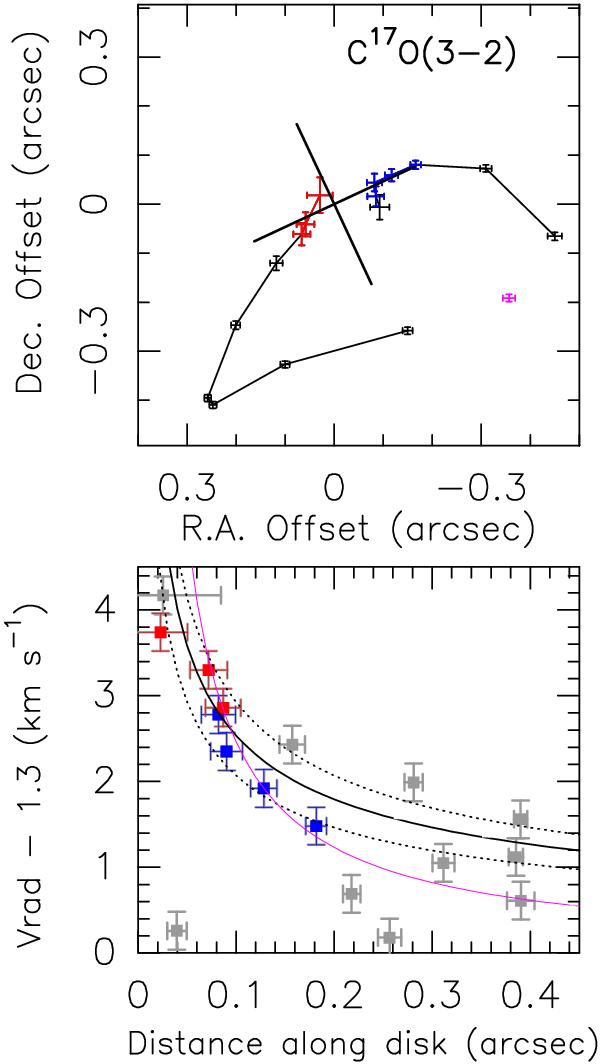
Upper panel: distribution of the C17O(3–2) centroid positions (from fits in the uv domain with 1σ error bars) in the various velocity channels (Fig. A.1). Red and blue datapoints denote the channels whose fitted centroids lie, within the error bars, on the equator. Bottom panel: velocity shift from Vsys as a function of distance from the protostar along the equator (PA = 122°). Red and blue datapoints denote the channels whose fitted centroids lie along the equator (see upper panel). The assumed systemic velocity is +1.3 km s-1 (see text). Grey points refer to LV emission tracing the C17O envelope and cavity. Black solid and dotted curves show Keplerian rotation around a stellar mass of 0.3 ± 0.1 M⊙. The r-1 curve for angular momentum conservation is plotted in magenta for comparison.
Current usage metrics show cumulative count of Article Views (full-text article views including HTML views, PDF and ePub downloads, according to the available data) and Abstracts Views on Vision4Press platform.
Data correspond to usage on the plateform after 2015. The current usage metrics is available 48-96 hours after online publication and is updated daily on week days.
Initial download of the metrics may take a while.