Fig. 2
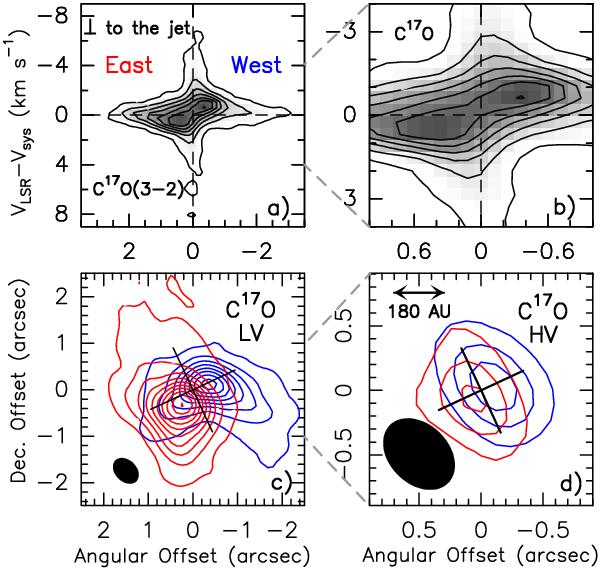
Panel a): position–velocity (PV) cut of C17O(3–2) perpendicular to the jet. First contour at 5σ (0.30 K) and steps of 20σ. Dashed lines mark Vsys = + 1.3 km s-1 and the continuum peak MM1. Panelb): zoom-in of the C17O(3–2) PV plot. Panelc): blue- and redshifted C17O(3–2) emission in the LV range (±0.6–1.5 km s-1 from Vsys), tracing the rotating outflow cavity. The tilted black cross indicates the SiO jet direction (PA = 22°) and the equatorial plane. First contour at 5σ (15 mJy beam-1 km s-1), then steps of 7σ. Panel d): same as panel c) for the HV velocity range (±1.9–3.5 km s-1 from systemic), tracing the rotating inner disk. Note the smaller spatial scale in panels b) and d).
Current usage metrics show cumulative count of Article Views (full-text article views including HTML views, PDF and ePub downloads, according to the available data) and Abstracts Views on Vision4Press platform.
Data correspond to usage on the plateform after 2015. The current usage metrics is available 48-96 hours after online publication and is updated daily on week days.
Initial download of the metrics may take a while.