| Issue |
A&A
Volume 556, August 2013
|
|
|---|---|---|
| Article Number | A23 | |
| Number of page(s) | 12 | |
| Section | Extragalactic astronomy | |
| DOI | https://doi.org/10.1051/0004-6361/201220968 | |
| Published online | 19 July 2013 | |
The low-extinction afterglow in the solar-metallicity host galaxy of γ-ray burst 110918A⋆,⋆⋆
1
Max-Planck-Institut für extraterrestrische Physik,
Giessenbachstraße 1,
85748
Garching, Germany
e-mail:
This email address is being protected from spambots. You need JavaScript enabled to view it.
2
Dark Cosmology Centre, Niels Bohr Institute, University of
Copenhagen, Juliane Maries Vej
30, 2100
Copenhagen,
Denmark
3
Instituto de Astrofísica de Andalucía (IAA-CSIC),
Glorieta de la Astronomía s/n,
18008
Granada,
Spain
4
The University of Leicester, Department of Physics and Astronomy,
University Road, Leicester, LE1
7RH, UK
5
Thüringer Landessternwarte Tautenburg, Sternwarte 5,
07778
Tautenburg,
Germany
6
Institute of Experimental and Applied Physics, Czech Technical
University in Prague, Horská
3a/22, 12800
Prague, Czech
Republic
7
Università degli studi di Milano-Bicocca,
Piazza della Scienza 3,
20126
Milano,
Italy
8
Harvard-Smithsonian Center for Astrophysics, 60 Garden
Street, Cambridge,
MA
02138,
USA
9
Department of Astronomy & Astrophysics, 525 Davey
Laboratory, Pennsylvania State University, University Park, PA
16802,
USA
10
Department of Physics, University of Warwick,
Coventry
CV4 7AL,
UK
11
Unidad Asociada Grupo Ciencia Planetarias UPV/EHU-IAA/CSIC,
Departamento de Física Aplicada I, E.T.S. Ingeniería, Universidad del País Vasco
UPV/EHU, Alameda de Urquijo
s/n, 48013
Bilbao,
Spain
12
Ikerbasque, Basque Foundation for Science, Alameda de Urquijo
36-5, 48008
Bilbao,
Spain
Received:
20
December
2012
Accepted:
30
May
2013
Abstract
Galaxies selected through long γ-ray bursts (GRBs) could be of fundamental importance when mapping the star formation history out to the highest redshifts. Before using them as efficient tools in the early Universe, however, the environmental factors that govern the formation of GRBs need to be understood. Metallicity is theoretically thought to be a fundamental driver in GRB explosions and energetics, but it is still, even after more than a decade of extensive studies, not fully understood. This is largely related to two phenomena: a dust-extinction bias, which prevented high-mass and thus likely high-metallicity GRB hosts from being detected in the first place, and a lack of efficient instrumentation, which limited spectroscopic studies, including metallicity measurements, to the low-redshift end of the GRB host population. The subject of this work is the very energetic GRB 110918A (Eγ,iso = 1.9 × 1054 erg), for which we measure a redshift of z = 0.984. GRB 110918A gave rise to a luminous afterglow with an intrinsic spectral slope of β = 0.70, which probed a sight-line with little extinction (AGRBV = 0.16 mag) and soft X-ray absorption (NH,X = (1.6 ± 0.5) × 1021 cm-2) typical of the established distributions of afterglow properties. However, photometric and spectroscopic follow-up observations of the galaxy hosting GRB 110918A, including optical/near-infrared photometry with the Gamma-Ray burst Optical Near-infrared Detector and spectroscopy with the Very Large Telescope/X-shooter, reveal an all but average GRB host in comparison to the z ~ 1 galaxies selected through similar afterglows to date. It has a large spatial extent with a half-light radius of R1/2 ~ 10 kpc, the highest stellar mass for z < 1.9 (log (M∗/M⊙) = 10.68 ± 0.16), and an Hα-based star formation rate of SFRHα = 41+28-16M⊙ yr-1. We measure a gas-phase extinction of AgasV ~ 1.8 mag through the Balmer decrement and one of the largest host-integrated metallicities ever of around solar using the well-constrained ratios of [N ii]/Hα and [N ii]/[O ii] (12 + log (O/H) = 8.93 ± 0.13 and 8.85+0.14-0.18, respectively). This presents one of the very few robust metallicity measurements of GRB hosts at z ~ 1, and establishes thatGRB hosts at z ~ 1 can also be very metal rich. It conclusively rules out a metallicity cut-off in GRB host galaxies and argues against an anti-correlation between metallicity and energy release in GRBs.
Key words: gamma-ray burst: general / gamma-ray burst: individual: 110918A / ISM: general / galaxies: abundances / galaxies: photometry / galaxies: star formation
Based on observations made with telescopes at the European Southern Observatory at La Silla/Paranal, Chile under program 090.A-0760(A).
Appendices are available in electronic form at http://www.aanda.org
© ESO, 2013
1. Introduction
During their prompt emission, long γ-ray bursts (GRBs) are the brightest objects in the Universe, easily reaching isotropic-equivalent luminosities as high as ~1054 erg s-1. Their observed association with supernovae events (e.g., Galama et al. 1998; Hjorth et al. 2003; Stanek et al. 2003; Matheson et al. 2003; Della Valle 2011; Hjorth et al. 2012) has tightly linked them to the death of massive stars. The GRB itself is then believed to result from accretion of matter onto the newly formed, rapidly rotating black hole or compact object in the collapsar model (Woosley 1993; Paczynski 1998; MacFadyen & Woosley 1999). The lack of hydrogen and helium in the spectra of GRB supernovae classify them as type Ic, supporting the notion that GRB progenitors are likely Wolf-Rayet-like stars (for a review of supernova classifications see, e.g., Filippenko 1997). Given that these type of stars undergo vigorous mass loss from stellar winds, metallicity constraints (Z < 0.3 Z⊙) on the progenitor are postulated to ensure that an accretion disk is still formed around the black hole (Hirschi et al. 2005; Yoon & Langer 2005; Woosley & Heger 2006).
The possible association of long GRBs with massive stars supported the idea that they could be used as complementary and independent tracers of star formation, especially at high redshifts (z ≳ 4), due to their very high luminosities (see, e.g., Daigne et al. 2006; Li 2008; Kistler et al. 2009; Ishida et al. 2011). However, to have full confidence in these studies the intrinsic evolutionary effects in long GRB production must be understood and the galactic environments preferred by the progenitor need to be quantified (e.g., Butler et al. 2010; Wang & Dai 2011; Salvaterra et al. 2012; Robertson & Ellis 2012; Elliott et al. 2012). Of particular interest is the relation between the galaxies selected by GRBs and the star formation weighted population of field galaxies. To be direct and unbiased tracers of star formation, the relative rates of GRBs in galaxies of various physical properties should be the same in galaxies taken from samples that trace the global star formation density at a given redshift. Studies based on these galaxy samples are most commonly performed at z ≲ 1.5, where the star formation of field galaxies is largely recovered by state-of-the-art, deep-field surveys.
Initial work showed that many long GRB host galaxies had a low mass, low metallicity, and blue colours and were actively star forming (see, e.g., Fruchter et al. 1999; Le Floc’h et al. 2003; Berger et al. 2003; Christensen et al. 2004; Tanvir et al. 2004). This seemed directly in line with the requirements of the collapsar model. Further work carried out with larger samples (e.g., Savaglio et al. 2009) again showed similar characteristics. However, at a given mass and star formation rate (SFR), long GRB hosts were also found to be no different from the normal population of star-forming galaxies at the same redshift (Mannucci et al. 2011). Yet, these initial studies neglected the contribution from galaxies hosting dust-extinguished afterglows, often termed dark bursts (e.g., Perley et al. 2009; Greiner et al. 2011). Galaxies hosting dark bursts are systematically more massive and have a higher dust content than the previously established population localised with optically bright afterglows (Krühler et al. 2011; Hjorth et al. 2012; Rossi et al. 2012; Perley et al. 2013; Christensen et al. 2011; de Ugarte Postigo et al. 2012). Despite the inclusion of this more evolved galaxy population, there are still fewer GRBs in massive galaxies than expected. This is based on their contribution to the overall SFR, at least for redshifts of z < 1.5 (Perley et al. 2013), which indicates that the GRB explosion mechanism is dependent on metallicity. It is, however, important to note that these conclusions are inferred indirectly through stellar mass as a metallicity proxy. In addition, while the photometric samples of GRB hosts have reached integrated number statistics of 100 and above (e.g., Hjorth et al. 2012; Perley et al. 2013), the most crucial measurement of gas-phase metallicity has only been performed in a handful of cases at z ≳ 1 (Levesque et al. 2010a; Krühler et al. 2012a).
Only a few host galaxies with substantial gas-phase metallicities around or above solar (e.g., Levesque et al. 2010b) that directly violate the proposed cut-off in galaxy metallicity have been observed to date. There is thus still lively debate in the literature about the nature of GRB hosts and their relation to the star formation weighted galaxy population as a whole (e.g., Niino 2011; Mannucci et al. 2011; Kocevski & West 2011; Graham & Fruchter 2012). The GRB hosts with high stellar mass and high global metallicity are hence of primary interest for GRB host studies as they directly probe this allegedly forbidden parameter space. A robust understanding of the galactic environments in which GRBs form would then add confidence to their use as cosmological probes beyond the limits of deep survey studies (e.g., Tanvir et al. 2012; Basa et al. 2012).
Here, we present spectroscopy and photometry of the host galaxy and afterglow of the luminous GRB 110918A, detected on the 18th of September 2011 at T0 = 21:26:57 UT (Hurley et al. 2011). This burst had one of the highest fluences of any GRB observed over the last 20 years (together with GRB 021206; Wigger et al. 2008) and had the highest peak flux ever detected by Konus-Wind (Golenetskii et al. 2011; Frederiks & Pal’shin 2011; Frederiks et al., in prep.), located at a redshift of z = 0.98. The massive, metal-rich host galaxy and unobscured afterglow of GRB 110918A challenges the current view of the connection between local and global environments and allows us to investigate the preferred conditions for the formation of a long GRB.
The paper is arranged as follows: first we describe the observations carried out by both
ground- and space-based instruments and their corresponding reduction in Sect. 2. Second, the resulting properties ascertained from the
spectral energy distributions (SED) and spectra of the GRB and its host are described in
Sect. 3. Finally, we discuss our findings and their
implications for the population of long GRBs in Sect. 4 and conclude in Sect. 5. We adopt the
convention that the GRB flux density is described by  and reported
errors are at the 1σ confidence level, additionally, we assume a ΛCDM
cosmology: H0 = 71 km s-1 Mpc-1,
ΩM = 0.27 and ΩΛ = 0.73. We use a Chabrier (2003) initial mass function (IMF) and abundances throughout the text.
and reported
errors are at the 1σ confidence level, additionally, we assume a ΛCDM
cosmology: H0 = 71 km s-1 Mpc-1,
ΩM = 0.27 and ΩΛ = 0.73. We use a Chabrier (2003) initial mass function (IMF) and abundances throughout the text.
2. Observations and data reduction
2.1. Swift-XRT spectra
At the time of the Interplanetary Network (IPN) trigger, Swift (Gehrels et al. 2004) was in both the South Atlantic
Anomaly and Earth-occulted, and so no trigger (Krimm
& Siegel 2011) was initiated in the Burst Alert Telescope (BAT, Barthelmy et al. 2005). However, the Swift
X-ray telescope (XRT, Burrows et al. 2005)
began observing the field of GRB 110918A (see Fig. 1)
at T0 + 107.4 ks until ~40 d later. The XRT spectrum shows
no signs of spectral evolution, remaining with a constant hardness ratio of ~0.85 for its
entire emission. We extracted a spectrum at the time interval of
T0 + 140 ks to T0 + 250 ks to
coincide with our optical/near-infrared (NIR) wavelength observations (see Fig. 2). The XRT spectral data were obtained from the public
Swift archive and regrouped to ensure at least 20 counts per bin in the
standard manner, using the grappha task from the HEAsoft package with
response matrices from CALDB v20120209. We assume a Galactic
hydrogen column of  (Kalberla et al. 2005) in the direction of the
burst.
(Kalberla et al. 2005) in the direction of the
burst.
2.2. GROND optical/NIR photometry
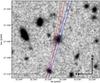 |
Fig. 1 GROND 60-min stacked i′ band image of the GRB 110918A host galaxy. The slit arrangement used in the acquisition image is shown for both the OSIRIS afterglow spectrum (red line) and host spectrum (blue line). |
The Gamma-Ray burst Optical Near-infrared Detector (GROND, Greiner et al. 2008), which is mounted at the MPG/ESO 2.2 m telescope at La Silla, Chile, began its follow-up campaign of GRB 110918A 29.2 h after the trigger simultaneously in the g′r′i′z′JHKs filters (Elliott et al. 2011). A mosaic of five pointings was carried out to cover the full IPN error box (~20′ × 20′), and the GRB optical afterglow candidate was detected at the location RA (J2000) = 02h10m09.34s, Dec (J2000) = − 27°06′19.7″, in GROND’s NIR chips, located just outside the IPN error box and consistent with the X-ray (Mangano et al. 2011) and optical (Tanvir et al. 2011) position with an uncertainty of 0.2″. The GROND observations continued for over one month after the GRB trigger, and an underlying host was discovered (see also Oksanen et al. 2011). Deep images of 3600 s in the NIR and 4500 s in the optical were obtained with GROND of the host galaxy at T0 + 36.37 d.
Image reduction and photometry of the GROND observations were carried out using standard Image Reduction and Analysis Facility tasks (IRAF; Tody 1993) in the way outlined in Krühler et al. (2008) and Yoldaş et al. (2008). In brief, a point-spread function (PSF) was obtained from the bright stars within the field and applied to the afterglow photometry. The absolute calibration of the optical photometry was achieved by observing a Sloan Digital Sky Survey (SDSS) field (Aihara et al. 2011) at RA (J2000) = 01h40m00.0s, Dec (J2000) = − 18°03′00.0″ and the GRB field consecutively. The NIR absolute calibration was obtained from the Two Micron Sky Survey (2MASS) stars (Skrutskie et al. 2006) within the field of the GRB. As a result of the extension of the galaxy (see Fig. 1), an aperture size of 3.2″ was used on the deep host galaxy images, within which the aperture flux flattened in a curve-of-growth analysis and the zero points were correspondingly corrected.
The scope of this paper does not involve a full analysis of the afterglow emission.
However, afterglow flux measurements are required at certain time intervals to implement
slit-loss corrections to the optical spectra and to determine the local extinction of the
afterglow. Therefore, we only present the required data and direct the reader to future
work for a full analysis of the afterglow1. For the
slit-loss correction of the afterglow, we obtain the following brightnesses in the AB
system (Oke & Gunn 1983) at a mid-time of
T0 + 2.2 d:
g′ = 20.50 ± 0.05 mag,
r′ = 20.20 ± 0.04 mag,
i′ = 19.96 ± 0.04 mag,
z′ = 19.83 ± 0.07 mag,
J = 19.46 ± 0.09 mag, H = 19.04 ± 0.10 mag,
Ks = 18.66 ± 0.19 mag. The magnitudes are uncorrected for
a Galactic dust reddening of
E(B − V)Gal = 0.020 mag
corresponding to an extinction of  for
RV = 3.1 (Schlegel et al. 1998).
for
RV = 3.1 (Schlegel et al. 1998).
2.3. WFI optical photometry
Further deep observations of the host galaxy were made 392 d after the trigger with the Wide Field Imager (Baade et al. 1999, WFI), which is also mounted on the MPG/ESO 2.2 m telescope, in the standard broadband filters BB#B/123_ESO878 (B) and BB#U/150_ESO878 (U). Two sets of images were taken: the first on 25 October 2012, consisting of 1800 s in U and 600 s in B, and the second on 26 October 2012, consisting of 150 s in U and 75 s in B. A calibration field was obtained on 26 October 2012 in both the U and B filters, and the standard field SA113+1582 was used as a primary calibrator. The photometry was carried out in the same way as the GROND images, and the magnitudes were converted into the AB system using the ESO magnitude converter3.
2.4. WISE IR photometry
The Wide-field Infrared Survey Explorer (Wright et al.
2010, WISE) All-Sky Source Catalogue4
reveals a source at the position of the host galaxy of GRB 110918A, with an
11σ and 3σ detection in the W1 and
W2 bands, which are centred at 3.4 μm and 4.6
μm, respectively. The wmpro magnitudes were used,
which are the magnitudes retrieved from profile-fitting photometry (or the magnitude of
the 95% confidence brightness) and converted into the AB system using the WISE conversion
factors5. Galactic reddening corrections were made
using the  conversions determined by Jarrett et al. (2012).
2.5. GMOS optical spectroscopy
The first spectrum of the afterglow was taken with the Gemini Multi-Object Spectrographs (Hook et al. 2004, GMOS) on the Gemini North telescope (Mauna Kea), starting at 12:52 UT on 20 September 2011, 1.6 d after the GRB trigger. Four exposures of 500 s each were obtained using the R400 grism and a 1′′ (~8.0 kpc projected at z = 0.984) slit width. Two of the spectra were obtained with a central wavelength of 6000 Å and the other two with 6050 Å to cover the detector gaps. In addition, a spatial dither was used to cover the amplifier boundaries. The resulting spectrum covers the range 3930−8170 Å. We reduced the data with tasks within the Gemini. GMOS package and IRAF, v1.11, using flat field and arc lamp frames taken directly before and after the science image.
2.6. OSIRIS optical spectroscopy
The second spectrum of the afterglow was obtained using the Optical System for Imaging and low Resolution Integrated Spectroscopy (OSIRIS, Cepa et al. 2000) mounted on the 10.4 m Gran Telescopio Canarias (Roque de los Muchachos) starting at 13:00 UT on 21 September 2011, 2.2 d after the GRB trigger. Three exposures of 900 s each were taken using the R500B grism and a 1′′ slit width obtained at the parallactic angle. The resulting spectrum covers the range 4400−8700 Å. Data were reduced and calibrated using standard procedures in IRAF. The spectrum was flux calibrated using G157-34 as a standard star and the 1D spectrum was scaled to the GROND afterglow photometry to correct for slit losses (correction factor of ~1.9).
A spectrum of the host was obtained on 11 November 2011, T0 + 54.1 d after the GRB trigger. A sequence of three 1200 s exposures was obtained with OSIRIS using the R1000R grism and a 1.0″ slit width, and covered the wavelength range of 5100 Å to 10 000 Å. The spectrum was flux calibrated using the standard star G191-B2B and corrected for slit losses by scaling the 1D spectrum to the photometry of the host galaxy obtained using GROND (correction factor of ~3.5).
2.7. X-shooter optical/NIR spectroscopy
We further observed the host of GRB 110918A with the cross-dispersed echelle spectrograph X-shooter (Vernet et al. 2011) on the Very Large Telescope Kueyen (UT2). The X-shooter has three individual arms taking spectra simultaneously in the range of 3000 Å to 5600 Å (UVB arm), 5600 Å to 10 200 Å (VIS arm), and 10 200 Å to 24 800 Å (NIR arm). Three different sets of observations were carried out on 17 December 2012, 07 January 2013, and 16 January 2013, respectively, with a position angle of 59° east of north. They consisted of a pair of nodded frames with exposure times of 1200 s in each of the UVB/VIS arms and 2 × 600 s in the NIR arm. The slit width was 1.′′6, 1.′′5, and 0.′′9 yielding a resolution measured on arc lamp frames of R ~ λ/Δλ = 3200, 4900, and 5300 in the UVB, VIS, and NIR arm, respectively. The NIR slit includes a blocking filter for the K-band, which limited our effective wavelength coverage to <20 500 Å but provided lower background levels in the J- and H-band.
Each of the individual observations was reduced and wavelength- and flux-calibrated separately using standard procedures within the X-shooter pipeline v2.0.0 (Goldoni et al. 2006) supplied by ESO. The individual 2D frames were then stacked using variance weighting in a heliocentric reference frame, and the 1D spectra were extracted using an optimal extraction method. Given the extent of the target, slit losses are substantial. Similar to the OSIRIS and GMOS spectroscopy, we scaled the well-detected continuum of the X-shooter data to the available photometric host SED. The consistency between matching factors derived from different photometric data in the individual arms6 provides confidence that the absolute flux calibration in the final X-shooter spectrum is accurate to better than ~20% over the full wavelength range of interest.
3. Results
3.1. The afterglow sight-line: dust, star formation rate, and gas
A broadband SED was constructed from the optical/NIR GROND photometry (see Sect. 2.2) at a mid-time of
T0 + 194 ks and X-ray data between
T0 + 140 ks and T0 + 250 ks.
The SED was fit in a standard manner (e.g., Filgas et al.
2011), assuming that the afterglow emission is well described by the standard
synchrotron mechanism. The best-fit single power-law
(χ2/d.o.f. = 85/73)
is shown in Fig. 2 with a spectral slope of
β = 0.70 ± 0.02, a hydrogen column density of
 cm-2, and
a line-of-sight extinction of
cm-2, and
a line-of-sight extinction of  , assuming a Small
Magellanic Cloud- (SMC) like dust with
RV = 2.93 in the parametrization of Pei (1992). Despite yielding an improved fit, a broken
power-law model is not warranted as the number of free parameters increases
(χ2/d.o.f. = 83/71),
implying that the improvement is not statistically significant. Nevertheless, the
resulting parameters of the best-fit broken power-laws models that use different dust
models are consistent with the uncertainties of the power-law values below the break at
~0.6 keV and do not alter our conclusions.
, assuming a Small
Magellanic Cloud- (SMC) like dust with
RV = 2.93 in the parametrization of Pei (1992). Despite yielding an improved fit, a broken
power-law model is not warranted as the number of free parameters increases
(χ2/d.o.f. = 83/71),
implying that the improvement is not statistically significant. Nevertheless, the
resulting parameters of the best-fit broken power-laws models that use different dust
models are consistent with the uncertainties of the power-law values below the break at
~0.6 keV and do not alter our conclusions.
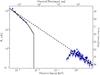 |
Fig. 2 Broadband SED of GRB 110918A, including optical, NIR, and X-ray data. The SED was
constructed using GROND data at a mid-time of
T0 + 194 ks and X-ray data between
T0 + 140 ks and
T0 + 250 ks. The best-fit parameters for a power-law
(χ2/d.o.f. = 85/73)
are: a spectral slope of β = 0.70 ± 0.02, a hydrogen column density
of |
Using the procedure outlined by de Ugarte Postigo et al. (2012) with the two afterglow spectra obtained with GMOS (T0 + 1.6d) and OSIRIS (T0 + 2.2d), we detect the transition of several metal ions including Fe ii, Mg ii, and Mg i at a common redshift of z = 0.984 ± 0.001 (see Tables 2 and B.1), which is consistent with galactic winds or star bursting periods (Fynbo et al. 2009; Nestor et al. 2011; Christensen et al. 2011; Rodríguez Hidalgo et al. 2012). In comparison with a long GRB sample (de Ugarte Postigo et al. 2012), we find that it has stronger absorption features than 80% of the sample.
3.2. The host’s stellar component: dust attenuation, star formation rate, and stellar mass
The host of GRB 110918A was detected in 11 different filters ranging from the
ultra-violet to 4.5 μm, yielding a well-sampled photometric SED (see
Fig. 3 and Table 1). To estimate the global properties of the host galaxy, we employed standard
techniques that use stellar population synthesis to estimate stellar masses, as outlined
thoroughly in Ilbert et al. (2009). We constructed
a grid of galaxy templates based on the models taken from Bruzual & Charlot (2003) over a wide parameter space consisting of a
range of ages (0−1.35 × 10⁹ yr), star formation histories
(∝eτ,τ = 0.1,0.3,1,2,3,5,10,15,30),
reddening values
(E(B − V) = 0−0.4 mag), a single
attenuation law (starburst; Calzetti et al. 2000)
and metallicities
(Z = 0.004,0.008,0.02). Emission lines
were also included, whereby the emission lines were estimated from the predicted UV
luminosity and converted to a SFR using Kennicutt
(1998). For each template, an SED was constructed for the filters required and a
χ2 was calculated using the Photometric Analysis for
Redshift Estimate routines, LePHARE7v2.2
(Arnouts et al. 1999; Ilbert et al. 2006). The best-fit template was the one
that gave the minimum χ2, and the corresponding uncertainties
for each parameter were obtained from the grid of χ2 values.
Systematic uncertainties of up to an average of 0.2−0.3 dex are expected in the
stellar mass value due to the adopted stellar population models and extinction laws (see,
e.g., Krühler et al. 2011, and references therein).
The filter response curves for the W1 and W2 bands were
obtained from Wright et al. (2010) and for the
U and B bands from the ESO web pages8. The results of the best-fit template, which had a
χ2/# Bands = 5.4/11,
had the following parameters: a mass of 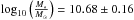 , an SED SFR of
 , a reddening of
E(B − V)stars = 0.26 ± 0.15 mag,
and a starburst age of
, a reddening of
E(B − V)stars = 0.26 ± 0.15 mag,
and a starburst age of  .
.
Host galaxy magnitudes.
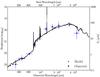 |
Fig. 3 SED of the host of GRB 110918A obtained using GROND, WFI and WISE data, amounting to 11 filters: UBg′r′i′z′JHKsW1W2 from left to right. The best-fit spectrum is depicted in black. |
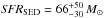
3.3. The host’s gas-phase component: dust extinction, star formation rate, and metallicity
The first host spectrum of GRB 110918A was obtained with OSIRIS/GTC in the optical wavelength range ~50 days after the trigger, and the second one was obtained with X-shooter more than 460 days post trigger. The X-shooter spectrum extends our spectral coverage to the NIR and thus to the wavelength range, where important tracers of SFR and metallicity are located. In summary, we clearly detect the Hα and Hβ transition from the Balmer series, as well as the forbidden transitions of [O ii](λλ3726, 3729) and [N ii](λ6584). The emission lines corresponding to [O iii](λλ4959,5007) are cosmologically redshifted to regions of low sensitivity for both OSIRIS and X-shooter and are thus not detected.
The velocity profile of the emission lines is clearly resolved by our X-shooter data and spans approximately 500 km s-1 in velocity space (see Fig. C.1). It displays a conspicuous two-humped profile, with the two peaks of the emission lines separated by 200 km s-1. However, we do not observe a spatial tilt in the line shape, as would have been expected from a largely rotationally supported galaxy (unless it is face on), and both peaks appear at the same spatial position in the 2D spectrum. Line fluxes were measured by numerically integrating the available data and cross-checked with fitting Gaussians. Both procedures return consistent values; from the X-shooter spectrum, we measure global9 emission-line fluxes of f[O ii] = (19.0 ± 3.1) × 10-17 erg s-1 cm-2, fHβ = (9.5 ± 1.9) × 10-17 erg s-1 cm-2, fHα = (47.8 ± 4.9) × 10-17 erg s-1 cm-2 and f[N ii ] = (15.3 ± 3.3) × 10-17 erg s-1 cm-2. The OSIRIS spectrum yields f[O ii] = (20.0 ± 2.8) × 10-17 erg s-1 cm-2, which is fully consistent with the X-shooter value.
Assuming the case B recombination (Osterbrock
1989) and using the standard values for electron density
(102 cm-3 ≲ ne ≲ 104 cm-3)
and temperature (Te ~ 104 K), the Balmer ratio of
Hα/Hβ implies an
 or visual extinction
  mag towards the star-forming regions assuming a Milky-Way-like extinction law10. This is the luminosity-weighted reddening/extinction
of the gas phase. This value is typically found to be a factor of around two larger than
the stellar E(B − V)stars
from the photometric SED model (e.g., Calzetti et al.
2000), which is consistent with our measurements for GRB 110918A. The
Hα line flux implies an SFR of
mag towards the star-forming regions assuming a Milky-Way-like extinction law10. This is the luminosity-weighted reddening/extinction
of the gas phase. This value is typically found to be a factor of around two larger than
the stellar E(B − V)stars
from the photometric SED model (e.g., Calzetti et al.
2000), which is consistent with our measurements for GRB 110918A. The
Hα line flux implies an SFR of  M⊙ yr-1,
following Kennicutt (1998) with a Chabrier (2003) IMF.
M⊙ yr-1,
following Kennicutt (1998) with a Chabrier (2003) IMF.
Using the different emission-line ratios, we can measure the gas-phase metallicity of the
galaxy hosting GRB 110918A (see e.g., Kewley &
Ellison 2008,for an extensive summary on those techniques). At
z ~ 1, we are limited to the diagnostic ratios based on
Hα, [O ii], and [N ii]. When the ratio of
[N ii] and Hα is used as a metallicity tracer, uncertainties
in the reddening or chromatic slit losses are not going to affect the overall results
because the respective lines are located very close in wavelength space. However,
[N ii]/Hα saturates at high metallicities
([N ii]/Hα ~ 0.3), while [N ii]/[O ii] does
not. The final uncertainties are thus comparable in both indicators, and we measure
12 + log (O/H)N2Hα = 8.93 ± 0.13 and
 using the formulation of Nagao et al. (2006).
Different calibrations of the strong-line diagnostics yield
12 + log (O/H)N2Hα = 8.63 ± 0.08 (Pettini & Pagel 2004) or
using the formulation of Nagao et al. (2006).
Different calibrations of the strong-line diagnostics yield
12 + log (O/H)N2Hα = 8.63 ± 0.08 (Pettini & Pagel 2004) or
 (Kewley & Dopita 2002). The inherent
systematic uncertainty of typically 0.1–0.2 dex (e.g., Nagao et al. 2006; Kewley & Ellison
2008) has not been included. These measurements imply metallicities between 0.9
and 1.7 times solar. All physical parameters of the galaxy hosting GRB 110918A are
summarized in Table 2.
(Kewley & Dopita 2002). The inherent
systematic uncertainty of typically 0.1–0.2 dex (e.g., Nagao et al. 2006; Kewley & Ellison
2008) has not been included. These measurements imply metallicities between 0.9
and 1.7 times solar. All physical parameters of the galaxy hosting GRB 110918A are
summarized in Table 2.
Physical parameters of the galaxy hosting GRB 110918A.
4. Discussion
4.1. Host galaxy identification
We have used absorption lines from metal ions in the afterglow spectrum (see also Fynbo et al. 2009 for an extensive sample) and
forbidden/recombination lines from the host galaxy to determine the redshift of the GRB
(see also Krühler et al. 2012b), but it is in
principle possible that the GRB lies at a higher redshift. To investigate if the host
galaxy of GRB 110918A has been misidentified, we calculate the commonly used p-value,
 , which is
the probability of finding a galaxy of magnitude m (or brighter)
overlapping the GRB within an effective radius
ri, assuming that galaxies are Poisson
distributed throughout the sky (Bloom et al. 2002).
This neglects any type of galaxy clustering; however, recent work indicates that GRB
locations do not preferentially lie in areas of strong galaxy overabundances (Cucchiara et al. 2012; Sudilovsky et al. 2013). The number of galaxies brighter than m
per square arcsecond is given by σ, taken from Bloom et al. (2002) and calculated from the work of Hogg et al. (1997).
, which is
the probability of finding a galaxy of magnitude m (or brighter)
overlapping the GRB within an effective radius
ri, assuming that galaxies are Poisson
distributed throughout the sky (Bloom et al. 2002).
This neglects any type of galaxy clustering; however, recent work indicates that GRB
locations do not preferentially lie in areas of strong galaxy overabundances (Cucchiara et al. 2012; Sudilovsky et al. 2013). The number of galaxies brighter than m
per square arcsecond is given by σ, taken from Bloom et al. (2002) and calculated from the work of Hogg et al. (1997).
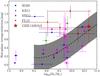 |
Fig. 4 Average line-of-sight extinction of the host galaxy vs. the stellar mass. Values from SG09 and MN11 have been converted from E(B − V)gas to E(B − V)stars using the relation from Calzetti et al. (2000). The dotted-black line is the polynomial fit determined by Garn & Best (2010), and the grey region denotes the uncertainty of 0.3 dex. |
The burst location of GRB 110918A is seen to be offset from the bright centroid of the
host by 12 kpc. However, in comparison to the half-light radius of the host galaxy,
 , the
offset is consistent with the long GRB population, which has a median offset of
, the
offset is consistent with the long GRB population, which has a median offset of
 (Bloom et al. 2002). We follow Bloom et al.
(2002) and set
(Bloom et al. 2002). We follow Bloom et al.
(2002) and set 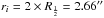 . Synthetic
RC-band (Bessell 1979) photometry of the GRB 110918A host galaxy is calculated using the
best-fit galaxy template taken from Sect. 3.2. Using
the AB-to-Vega conversions given in Rossi et al.
(2012) results in RC = 21.7 magVega.
This yields a probability of chance association of p = 0.01, making this
galaxy highly likely the host of GRB 110918A.
. Synthetic
RC-band (Bessell 1979) photometry of the GRB 110918A host galaxy is calculated using the
best-fit galaxy template taken from Sect. 3.2. Using
the AB-to-Vega conversions given in Rossi et al.
(2012) results in RC = 21.7 magVega.
This yields a probability of chance association of p = 0.01, making this
galaxy highly likely the host of GRB 110918A.
The non-detection of the Lyman forest above ~4500 Å implies a strong upper limit of z < 2.7. Therefore, using our knowledge of the strength of spectral features in GRB environments and their distribution (de Ugarte Postigo et al. 2012), we can estimate the likelihood of the GRB having occurred between redshift 1.0 and 2.7 and yet not having detectable absorption lines at the redshift of the host in its spectrum. We calculated the detection limits for Mg ii and C iv doublets as described by de Ugarte Postigo et al. (2012) and found that the lines would have to be weaker than 99.7% of a normal long GRB sample to have happened at a redshift between 1 and 2.7. Furthermore, the properties of the absorber (strong Mg ii absorption and vigorous star formation, see Sect. 3.1), are very common in other afterglow observations and do not indicate a different physical nature. Combining the arguments presented above, we consider the redshift of the GRB and, accordingly, the physical association between the GRB and the host GRB galaxy, robust.
4.2. Host environment in the context of the GRB-Host population
The mass-metallicity relation of field galaxies (e.g., Tremonti et al. 2004) has been studied in depth to high redshift (Savaglio et al. 2005; Erb et al. 2006; Yabe et al. 2012). Similarly, the dust content of a given galaxy is also well known to correlate with stellar mass (e.g., Garn & Best 2010; Zahid et al. 2013). To illustrate the behaviour for GRB hosts, we show the average host galaxy extinction versus the stellar mass of the host galaxy alongside the correlation determined by Garn & Best (2010) in Fig. 4. The GRB hosts are taken from Savaglio et al. (2009, SG09), Mannucci et al. (2011, MN11), Krühler et al. (2011, KR11), and Perley et al. (2013, PL13) and converted to a Chabrier IMF, if need be. The correlation of Garn & Best (2010) has been determined from SDSS galaxies with z < 0.7, and so we limited our GRB sample to galaxies with z < 1.0. GRB hosts follow the distribution obtained from field galaxies well, with a possible excess of dusty systems at stellar masses of 109−10 M⊙. Given the inherent systematic difficulties of determining the dust reddening in galaxies and the heterogeneous selection of targets (in particular, the KR11 and PL13 samples were initially selected to contain a lot of dust), this trend should not be over-interpreted. What seems clear is that the host of GRB 110918A is at the high end of the distribution of stellar masses for GRB hosts and there is no strong discrepancy between GRB-selected galaxies and field galaxies in the relation between their dust content and stellar mass.
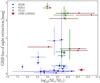 |
Fig. 5 GRB line-of-sight |

Secondly, we plot the host’s stellar mass vs. the GRB’s line-of-sight extinction in Fig.
5. Perley et al.
(2013) have highlighted that throughout the covered galaxy-mass scale there is a
very tight correlation between stellar-mass and sight-line extinction probed by the GRBs.
Quite surprisingly, this correlation between afterglow dust and galaxy mass is found to be
stronger than for any other physical property of the galaxy (PL13). From Fig. 5 it can be seen that hosts selected due to high
afterglow extinction (green, KR11; brown PL13) have systematically more massive and
dust-extinguished sight lines than the optically selected hosts (blue, SG09). Outliers to
this trend, such as GRB 061222A or GRB 100621A, have already been noted (e.g., Krühler et al. 2011; Perley et al. 2009). They were within blue, low-mass galaxies that were locally
strongly extinguished along the line of sight. GRB 110918A is the first example of a
dust-poor line-of-sight with a galaxy mass at the high-end of the distribution (i.e.,
 ). While in principle,
cases like GRB 110918A would be easy to identify (bright afterglow, easy localisation,
bright host), no comparable example has been reported in the literature to date.
). While in principle,
cases like GRB 110918A would be easy to identify (bright afterglow, easy localisation,
bright host), no comparable example has been reported in the literature to date.
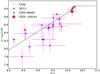 |
Fig. 6 Metallicity determined from the fundamental metallicity relation (taken from MN11) vs. the parametric quantity μ0.32, plotted in grey for a range of SFRs (SFR = 0−100 M⊙ yr-1). Real quantities are plotted for MN11 (magenta squares), GRB 080605 (Krühler et al. 2012a, cyan upward-pointing triangle), and GRB 110918A (red). The host of GRB 110918A is well described by the SDSS-determined FMR. |
The host of GRB 110918A shows host-integrated extinction
( ) that is similar to
galaxies of a similar mass range (e.g.,
M∗ > 1010 M⊙
in Fig. 4 and
M∗ > 4 × 10⁹ M⊙
in Fig. 15 of Perley et al. (2013) have an
) that is similar to
galaxies of a similar mass range (e.g.,
M∗ > 1010 M⊙
in Fig. 4 and
M∗ > 4 × 10⁹ M⊙
in Fig. 15 of Perley et al. (2013) have an
 ). However, in comparison to
the systems of similar mass, GRB 110918A exhibits at least ten times less extinction along
the GRB line-of-sight. Therefore, it is possible that: (i) the geometry of dust within the
host of GRB 110918A is more patchy than homogeneous in comparison to the rest of the
massive GRB host population, in agreement with the example of GRB 100621A and 061222A,
whereby clumpy dust was one explanation for having a highly extinguished afterglow within
an unobscured galaxy (Krühler et al. 2011; Perley et al. 2013); or (ii) the progenitor had enough
time to destroy local dust from its UV emission (see Perley et al. 2013 and references therein).
). However, in comparison to
the systems of similar mass, GRB 110918A exhibits at least ten times less extinction along
the GRB line-of-sight. Therefore, it is possible that: (i) the geometry of dust within the
host of GRB 110918A is more patchy than homogeneous in comparison to the rest of the
massive GRB host population, in agreement with the example of GRB 100621A and 061222A,
whereby clumpy dust was one explanation for having a highly extinguished afterglow within
an unobscured galaxy (Krühler et al. 2011; Perley et al. 2013); or (ii) the progenitor had enough
time to destroy local dust from its UV emission (see Perley et al. 2013 and references therein).
4.3. Fundamental metallicity relation
The difference between galaxies of long GRBs and that of normal star forming field
galaxies is an ongoing debate. We have derived estimates for the mass, metallicity, and
SFR of the host of GRB 110918A, which facilitates comparing this galaxy with respect to
normal star forming galaxies through the fundamental metallicity relation (FMR; Mannucci et al. 2011). The plane of the FMR was derived
from star forming SDSS galaxies in the mass range  and is described by
 (1)where
 .
Using the SED-determined mass and the H α-determined SFR, the metallicity
from the FMR is 12 + log (O/H) = 8.98 ± 0.08, in agreement with the
metallicity from the N ii/H α line ratio of
12 + log (O/H) = 8.93 ± 0.13. The method used in our metallicity
estimate is the same as the one used by MN11 to construct the FMR in order to ensure a
direct comparison. The estimated errors are based purely on the uncertainties of the mass
and SFR, and any systematic uncertainties from the method used to fit the stellar mass
have been ignored.
.
Using the SED-determined mass and the H α-determined SFR, the metallicity
from the FMR is 12 + log (O/H) = 8.98 ± 0.08, in agreement with the
metallicity from the N ii/H α line ratio of
12 + log (O/H) = 8.93 ± 0.13. The method used in our metallicity
estimate is the same as the one used by MN11 to construct the FMR in order to ensure a
direct comparison. The estimated errors are based purely on the uncertainties of the mass
and SFR, and any systematic uncertainties from the method used to fit the stellar mass
have been ignored.
The agreement in the characteristic properties of the host galaxy of GRB 110918A with the FMR (see Fig. 6) shows that the host galaxy has no deficit of metals in comparison to normal field galaxies, which is in line with the conclusions of SG09, MN11, KR11, and Michałowski et al. (2012). This illustrates that the mass and SFR of a GRB-selected galaxy, at least for this one event, can be used as a fair proxy for the metallicity, even in the solar or super-solar regime.
4.4. Metallicity and long GRB progenitors
Many authors have attributed the fact that most long GRB host galaxies exhibit low metallicities as the result of an environmental preference, rather than the effect of the FMR (e.g., Modjaz et al. 2008; Graham & Fruchter 2012; Perley et al. 2013). This dependence on metallicity has also led to the prediction that the lower the progenitor metallicity, the larger the angular momentum and thus the higher the energy output (Eγ,iso) of the GRB (MacFadyen & Woosley 1999). Initial studies indeed showed an anti-correlation between these two quantities (Stanek et al. 2006), together with a cut-off metallicity above which long GRBs (for z < 0.2) are no longer created, i.e., Z < 0.15 Z⊙. However, more recent studies, which include long GRBs at cosmological redshifts and exclude sub-luminous GRBs (Wolf & Podsiadlowski 2007; Levesque et al. 2010c), indicate that there is no clear anti-correlation between metallicity and the GRB’s energy output, as shown in Fig. 7. The prompt emission of GRB 110918A yielded an energy output of Eγ,iso = 1.9 × 1054 erg (Frederiks & Pal’shin 2011) within the top 2% of the GRB population (Frederiks et al. 2013; Amati et al. 2008). This makes GRB 110918A one of the most energetic long GRBs yet observed and its host one of the most metal-rich galaxies, in contradiction to the idea of a correlation between Eγ,iso and metallicity.
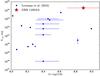 |
Fig. 7 Isotropic-equivalent energy release in γ-rays of GRBs plotted against the gas-phase metallicity of the host galaxy. Blue data are taken from Levesque et al. (2010c). |
Recently, Perley et al. (2013) performed an extensive photometric study of host galaxies selected from a sample of dark bursts, limiting the selection biases present in previous works. However, while the inclusion of dark GRB hosts increases the consistency of GRB hosts with the star formation weighted sample of field galaxies, there is still a clear lack of high-mass galaxies at z ≲ 1.5. Associating the galaxy mass with metallicity, this provides indirect evidence for a metallicity effect in GRB hosts. A similar conclusion was reached based on a comparison of long GRB hosts with supernovae hosts (Graham & Fruchter 2012), namely, that long GRB hosts show a strong preference for lower metallicity environments relative to other populations of star forming galaxies, with a metallicity cut-off of Z < 0.5 Z⊙. This cut-off is not consistent with the host galaxy of GRB 110918A, even if metallicity dispersions of ~0.3 dex are considered (Niino 2011).
5. Conclusion
We observed the afterglow of GRB 110918A and its associated host galaxy and obtained photometry and spectroscopy of both. The extensive follow-up campaign has allowed us to measure the afterglow sight-line extinction, along with the attenuation of the galaxy’s stellar and gas-phase component. We further derive the host’s integrated SFR, stellar mass, and gas-phase metallicity. In summary, this burst has revealed the following properties with respect to the long GRB population:
-
1.
The SED-determined stellar mass of
 makes the host ofGRB 110918A one of the most massive galaxiesselected by a GRB at
z ~ 1.
makes the host ofGRB 110918A one of the most massive galaxiesselected by a GRB at
z ~ 1. -
2.
GRB 110918A is the first relatively unobscured afterglow (
 )
that has been detected in a very massive host galaxy, suggesting either that the
geometry of dust is more clumpy than homogeneous or that local dust has been destroyed
by the progenitor.
)
that has been detected in a very massive host galaxy, suggesting either that the
geometry of dust is more clumpy than homogeneous or that local dust has been destroyed
by the progenitor. -
3.
The optical/NIR spectrum reveals a solar metallicity environment (0.9−1.7 Z⊙, depending on the chosen diagnostic), making it one of the most metal-rich long GRB host galaxies found yet.
-
4.
Using the fundamental metallicity relation and the measured SFR, stellar mass, and metallicity, we show that the host of GRB 110918A is no different from star-forming galaxies selected through their own stellar light.
-
5.
The large energy output from the γ-ray emission of GRB 110918A and the large metallicity content of the host galaxy are in strong contradiction with the existence of an anti-correlation between energy output of the GRB and environmental metallicity.
-
6.
Finally, the solar abundance of metals contradicts a cut-off for host galaxies of Z < 0.5 Z⊙, even if a chemical dispersion of ~0.3 dex existed.
Online material
Appendix A: The afterglow light curve
The afterglow of GRB 110918A was imaged for over 40 days after the trigger with GROND in the g′r′i′z′JHKS bands (outlined in Sect. 2.2). Using the deep observations of the host, the underlying contribution from the host galaxy was subtracted implementing the High Order Transform of PSF and Template Subtraction package, HOTPANTS11 v5.1.10b. The resulting afterglow light curve can be seen in Fig. A.1, while the raw data can be found in Tables A.2 and A.3 and the host subtracted data in Tables A.4 and A.5. The standard stars used in g′r′i′z′ for relative calibration can be found in Table A.1.
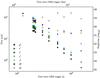 |
Fig. A.1 Afterglow light curve of GRB 110918A obtained with the 7-channel imager GROND (host subtracted). |
Optical reference stars.
GROND photometric data g′r′i′z′.
GROND photometric data JHKs.
GROND host-subtracted photometric data g′r′i′z′.
GROND host subtracted photometric data JHKs.
Appendix B: The afterglow’s sight-line spectrum
The spectra obtained with GMOS and OSIRIS (see Sect. 2.6) reveal many absorption lines of gas along the line-of-sight toward the afterglow, specifically of the following species: Fe ii (2344, 2374, 2382, 2586, 2600), Mg ii (2803, 2796), Mg i (2853), and Ca ii (3935, 3970). The equivalent widths of the metals are listed in Table B.1.
Equivalent widths measured for the absorption lines of the afterglow.
Appendix C: The host’s emission lines
Two spectra of the host galaxy were obtained with OSIRIS and X-shooter (see Sect. 3.3), showing the following emission lines: Hα and Hβ transitions from the Balmer series and also forbidden transitions of [O ii] and [N ii] (only [O ii] emission was detected with OSIRIS, and so for consistency only the X-shooter emission lines are shown). All of the 2D spectral images and 1D Gaussian fits can be seen in Fig. C.1.
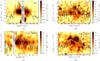 |
Fig. C.1 2D spectra of the host of GRB 110918A depicting four different emissions ([N ii], [O ii], Hα, Hβ). Overplotted is our Gaussian fit, where areas that overlay telluric lines are shown in white and excluded from the fit. All the values presented are raw values and do not include slit-loss or extinction corrections. Each image has been smoothed in both pixel directions for presentation purposes. a) The Balmer series transition Hα; b) the Balmer series transition Hβ; c) the forbidden transition [N ii]; d) the forbidden transition [O ii]. |
The afterglow light curves are found in the Appendix.
We derive factors for the r′-, i′-, and z′-band data in the VIS arm of 3.1 ± 0.3, 2.8 ± 0.3, 2.8 ± 0.3, and 3.5 ± 0.4, 3.3 ± 0.3 for the J- and H-band in the NIR arm. The offset between the VIS and NIR arm is readily explained by the smaller slit width in the NIR arm.
Here and in the following, the error includes both the statistical error of the measurement and the error in slit-loss correction.
Different local extinction laws yield comparable results, as there is little difference in the wavelength range of the Hα and Hβ Balmer lines.
Acknowledgments
We thank the anonymous referees for their constructive criticisms, Régis Lachaume for the WFI observations, and Mara Salvato and Ivan Baldry for helpful discussions. Part of the funding for GROND (both hardware as well as personnel) was generously granted from the Leibniz-Prize to Prof. G. Hasinger (DFG grant HA 1850/28-1). Based on observations made with the Gran Telescopio Canarias (GTC), that is installed in the Spanish Observatorio del Roque de los Muchachos of the Instituto de Astrofísica de Canarias on the island of La Palma. This work made use of data supplied by the UK Swift Science Data Centre at the University of Leicester. This publication makes use of data products from the Wide-field Infrared Survey Explorer, which is a joint project of the University of California, Los Angeles, and the Jet Propulsion Laboratory/California Institute of Technology, funded by the National Aeronautics and Space Administration. A.d.U.P. acknowledges support from a Marie Curie Career Integration Grant Fellowship. T.K. acknowledges support by the European Commission under the Marie Curie Intra-European Fellowship Programme. The Dark Cosmology Centre is funded by the Danish National Research Foundation. SS acknowledges support through project M.FE.A.Ext 00003 of the MPG. F.O.E. acknowledges funding of his Ph.D. through the Deutscher Akademischer Austausch-Dienst (DAAD). A.d.U.P., C.T., R.S.R., and J.G. acknowledge support from the Spanish research projects AYA2012-39362-C02-02, AYA2011-24780/ESP, AYA2009-14000-C03-01/ESP, and AYA2010-21887-C04-01. A.d.U.P. acknowledges support from The Dark Cosmology Centre. K.W. acknowledges support by the STFC. P.S. acknowledges support by DFG grant SA 2001/1-1. D.A.K. acknowledges support by the DFG cluster of excellence Origin and Structure of the Universe. S.K., A.N.G., and A.R. acknowledge support by DFG grant Kl 766/16-1. A.R., A.N.G., A.K., and D.A.K. are grateful for travel funding support through MPE. M.N. acknowledges support by DFG grant SA 2001/2-1. E.B. acknowledges support from the National Science Foundation through Grant AST-1107973. J.E. is thankful for the support from A. and G. Elliott.
References
- Aihara, H., Allen de Prieto, C., An, D., et al. 2011, ApJS, 193, 29 [NASA ADS] [CrossRef] [Google Scholar]
- Amati, L., Guidorzi, C., Frontera, F., et al. 2008, MNRAS, 391, 577 [NASA ADS] [CrossRef] [MathSciNet] [Google Scholar]
- Arnouts, S., Cristiani, S., Moscardini, L., et al. 1999, MNRAS, 310, 540 [NASA ADS] [CrossRef] [Google Scholar]
- Baade, D., Meisenheimer, K., Iwert, O., et al. 1999, The Messenger, 95, 15 [NASA ADS] [Google Scholar]
- Barthelmy, S. D., Barbier, L. M., Cummings, J. R., et al. 2005, Space Sci. Rev., 120, 143 [NASA ADS] [CrossRef] [Google Scholar]
- Basa, S., Cuby, J. G., Savaglio, S., et al. 2012, A&A, 542, A103 [NASA ADS] [CrossRef] [EDP Sciences] [Google Scholar]
- Berger, E., Cowie, L. L., Kulkarni, S. R., et al. 2003, ApJ, 588, 99 [NASA ADS] [CrossRef] [Google Scholar]
- Bessell, M. S. 1979, PASP, 91, 589 [NASA ADS] [CrossRef] [Google Scholar]
- Bloom, J. S., Kulkarni, S. R., & Djorgovski, S. G. 2002, AJ, 123, 1111 [NASA ADS] [CrossRef] [Google Scholar]
- Bruzual, G., & Charlot, S. 2003, MNRAS, 344, 1000 [NASA ADS] [CrossRef] [Google Scholar]
- Burrows, D. N., Hill, J. E., Nousek, J. A., et al. 2005, Space Sci. Rev., 120, 165 [NASA ADS] [CrossRef] [Google Scholar]
- Butler, N. R., Bloom, J. S., & Poznanski, D. 2010, ApJ, 711, 495 [NASA ADS] [CrossRef] [Google Scholar]
- Calzetti, D., Armus, L., Bohlin, R. C., et al. 2000, ApJ, 533, 682 [NASA ADS] [CrossRef] [Google Scholar]
- Cepa, J., Aguiar, M., Escalera, V. G., et al. 2000, in SPIE Conf. Ser., 4008, eds. M. Iye, & A. F. Moorwood, 623 [Google Scholar]
- Chabrier, G. 2003, PASP, 115, 763 [NASA ADS] [CrossRef] [Google Scholar]
- Christensen, L., Hjorth, J., & Gorosabel, J. 2004, A&A, 425, 913 [NASA ADS] [CrossRef] [EDP Sciences] [Google Scholar]
- Christensen, L., Fynbo, J. P. U., Prochaska, J. X., et al. 2011, ApJ, 727, 73 [NASA ADS] [CrossRef] [Google Scholar]
- Cucchiara, A., Prochaska, J. X., Zhu, G., et al. 2012, MNRAS, 426, 2078 [NASA ADS] [CrossRef] [Google Scholar]
- Daigne, F., Rossi, E. M., & Mochkovitch, R. 2006, MNRAS, 372, 1034 [NASA ADS] [CrossRef] [Google Scholar]
- de Ugarte Postigo, A., Fynbo, J. P. U., Thöne, C. C., et al. 2012, A&A, 548, A11 [NASA ADS] [CrossRef] [EDP Sciences] [Google Scholar]
- Della Valle, M. 2011, Inter. J. Mod. Phys. D, 20, 1745 [Google Scholar]
- Elliott, J., Kruehler, T., Klose, S., et al. 2011, GRB Coordinates Network, 12366, 1 [Google Scholar]
- Elliott, J., Greiner, J., Khochfar, S., et al. 2012, A&A, 539, A113 [NASA ADS] [CrossRef] [EDP Sciences] [Google Scholar]
- Erb, D. K., Shapley, A. E., Pettini, M., et al. 2006, ApJ, 644, 813 [NASA ADS] [CrossRef] [Google Scholar]
- Filgas, R., Greiner, J., Schady, P., et al. 2011, A&A, 535, A57 [NASA ADS] [CrossRef] [EDP Sciences] [Google Scholar]
- Filippenko, A. V. 1997, ARA&A, 35, 309 [NASA ADS] [CrossRef] [Google Scholar]
- Frederiks, D., & Pal’shin, V. 2011, GRB Coordinates Network, 12370, 1 [Google Scholar]
- Fruchter, A. S., Thorsett, S. E., Metzger, M. R., et al. 1999, ApJ, 519, L13 [NASA ADS] [CrossRef] [Google Scholar]
- Fynbo, J. P. U., Jakobsson, P., Prochaska, J. X., et al. 2009, ApJS, 185, 526 [NASA ADS] [CrossRef] [Google Scholar]
- Galama, T. J., Vreeswijk, P. M., van Paradijs, J., et al. 1998, Nature, 395, 670 [NASA ADS] [CrossRef] [Google Scholar]
- Garn, T., & Best, P. N. 2010, MNRAS, 409, 421 [NASA ADS] [CrossRef] [Google Scholar]
- Gehrels, N., Chincarini, G., Giommi, P., et al. 2004, ApJ, 611, 1005 [NASA ADS] [CrossRef] [Google Scholar]
- Goldoni, P., Royer, F., François, P., et al. 2006, in SPIE Conf. Ser., 6269 [Google Scholar]
- Golenetskii, S., Aptekar, R., Frederiks, D., et al. 2011, GRB Coordinates Network, 12362, 1 [Google Scholar]
- Graham, J. F., & Fruchter, A. S. 2012, ApJ, submitted [arXiv:1211.7068] [Google Scholar]
- Greiner, J., Bornemann, W., Clemens, C., et al. 2008, PASP, 120, 405 [NASA ADS] [CrossRef] [Google Scholar]
- Greiner, J., Krühler, T., Klose, S., et al. 2011, A&A, 526, A30 [NASA ADS] [CrossRef] [EDP Sciences] [Google Scholar]
- Hirschi, R., Meynet, G., & Maeder, A. 2005, A&A, 443, 581 [NASA ADS] [CrossRef] [EDP Sciences] [Google Scholar]
- Hjorth, J., Sollerman, J., Møller, P., et al. 2003, Nature, 423, 847 [NASA ADS] [CrossRef] [PubMed] [Google Scholar]
- Hjorth, J., Malesani, D., Jakobsson, P., et al. 2012, ApJ, 756, 187 [NASA ADS] [CrossRef] [Google Scholar]
- Hogg, D. W., Pahre, M. A., McCarthy, J. K., et al. 1997, MNRAS, 288, 404 [NASA ADS] [CrossRef] [Google Scholar]
- Hook, I. M., Jørgensen, I., Allington-Smith, J. R., et al. 2004, PASP, 116, 425 [NASA ADS] [CrossRef] [Google Scholar]
- Hurley, K., Golenetskii, S., Aptekar, R., et al. 2011, GRB Coordinates Network, 12357, 1 [Google Scholar]
- Ilbert, O., Arnouts, S., McCracken, H. J., et al. 2006, A&A, 457, 841 [NASA ADS] [CrossRef] [EDP Sciences] [Google Scholar]
- Ilbert, O., Capak, P., Salvato, M., et al. 2009, ApJ, 690, 1236 [NASA ADS] [CrossRef] [Google Scholar]
- Ishida, E. E. O., de Souza, R. S., & Ferrara, A. 2011, MNRAS, 418, 500 [NASA ADS] [CrossRef] [Google Scholar]
- Jarrett, T. H., Masci, F., Tsai, C. W., et al. 2012, AJ, 144, 68 [NASA ADS] [CrossRef] [Google Scholar]
- Kalberla, P. M. W., Burton, W. B., Hartmann, D., et al. 2005, A&A, 440, 775 [NASA ADS] [CrossRef] [EDP Sciences] [Google Scholar]
- Kann, D. A., Klose, S., & Zeh, A. 2006, ApJ, 641, 993 [NASA ADS] [CrossRef] [Google Scholar]
- Kann, D. A., Klose, S., Zhang, B., et al. 2010, ApJ, 720, 1513 [NASA ADS] [CrossRef] [Google Scholar]
- Kennicutt, Jr., R. C. 1998, ARA&A, 36, 189 [Google Scholar]
- Kewley, L. J., & Dopita, M. A. 2002, ApJS, 142, 35 [NASA ADS] [CrossRef] [Google Scholar]
- Kewley, L. J., & Ellison, S. L. 2008, ApJ, 681, 1183 [NASA ADS] [CrossRef] [Google Scholar]
- Kistler, M. D., Yüksel, H., Beacom, J. F., Hopkins, A. M., & Wyithe, J. S. B. 2009, ApJ, 705, L104 [NASA ADS] [CrossRef] [Google Scholar]
- Kocevski, D., & West, A. A. 2011, ApJ, 735, L8 [NASA ADS] [CrossRef] [Google Scholar]
- Krimm, H. A., & Siegel, H. v. M. 2011, GCN Report, 350, 1 [NASA ADS] [Google Scholar]
- Krühler, T., Küpcü Yoldaş, A., Greiner, J., et al. 2008, ApJ, 685, 376 [NASA ADS] [CrossRef] [Google Scholar]
- Krühler, T., Greiner, J., Schady, P., et al. 2011, A&A, 534, A108 [NASA ADS] [CrossRef] [EDP Sciences] [Google Scholar]
- Krühler, T., Fynbo, J. P. U., Geier, S., et al. 2012a, A&A, 546, A8 [NASA ADS] [CrossRef] [EDP Sciences] [Google Scholar]
- Krühler, T., Malesani, D., Milvang-Jensen, B., et al. 2012b, ApJ, 758, 46 [NASA ADS] [CrossRef] [Google Scholar]
- Le Floc’h, E., Duc, P.-A., Mirabel, I. F., et al. 2003, A&A, 400, 499 [NASA ADS] [CrossRef] [EDP Sciences] [Google Scholar]
- Levesque, E. M., Berger, E., Kewley, L. J., & Bagley, M. M. 2010a, AJ, 139, 694 [NASA ADS] [CrossRef] [Google Scholar]
- Levesque, E. M., Kewley, L. J., Berger, E., & Zahid, H. J. 2010b, AJ, 140, 1557 [NASA ADS] [CrossRef] [Google Scholar]
- Levesque, E. M., Soderberg, A. M., Kewley, L. J., & Berger, E. 2010c, ApJ, 725, 1337 [NASA ADS] [CrossRef] [Google Scholar]
- Li, L. 2008, MNRAS, 388, 1487 [NASA ADS] [CrossRef] [Google Scholar]
- MacFadyen, A. I., & Woosley, S. E. 1999, ApJ, 524, 262 [NASA ADS] [CrossRef] [Google Scholar]
- Mangano, V., Sbarufatti, B., Evans, P. A., & Krimm, H. A. 2011, GRB Coordinates Network, 12364, 1 [Google Scholar]
- Mannucci, F., Salvaterra, R., & Campisi, M. A. 2011, MNRAS, 414, 1263 [NASA ADS] [CrossRef] [Google Scholar]
- Matheson, T., Garnavich, P. M., Stanek, K. Z., et al. 2003, ApJ, 599, 394 [NASA ADS] [CrossRef] [Google Scholar]
- Michałowski, M. J., Kamble, A., Hjorth, J., et al. 2012, ApJ, 755, 85 [NASA ADS] [CrossRef] [Google Scholar]
- Modjaz, M., Kewley, L., Kirshner, R. P., et al. 2008, AJ, 135, 1136 [NASA ADS] [CrossRef] [Google Scholar]
- Nagao, T., Maiolino, R., & Marconi, A. 2006, A&A, 459, 85 [NASA ADS] [CrossRef] [EDP Sciences] [Google Scholar]
- Nestor, D. B., Johnson, B. D., Wild, V., et al. 2011, MNRAS, 412, 1559 [NASA ADS] [CrossRef] [Google Scholar]
- Niino, Y. 2011, MNRAS, 417, 567 [NASA ADS] [CrossRef] [Google Scholar]
- Oke, J. B., & Gunn, J. E. 1983, ApJ, 266, 713 [NASA ADS] [CrossRef] [Google Scholar]
- Oksanen, A., Schaefer, B., Harlingten, C., & Templeton, M. 2011, GRB Coordinates Network, 12458, 1 [Google Scholar]
- Osterbrock, D. E. 1989, Astrophysics of gaseous nebulae and active galactic nuclei, 78, 491 [Google Scholar]
- Paczynski, B. 1998, ApJ, 494, L45 [NASA ADS] [CrossRef] [Google Scholar]
- Pei, Y. C. 1992, ApJ, 395, 130 [NASA ADS] [CrossRef] [Google Scholar]
- Perley, D. A., Cenko, S. B., Bloom, J. S., et al. 2009, AJ, 138, 1690 [NASA ADS] [CrossRef] [Google Scholar]
- Perley, D. A., Levan, A. J., Tanvir, N. R., et al. 2013, ApJ, submitted [arXiv:1301.5903] [Google Scholar]
- Pettini, M., & Pagel, B. E. J. 2004, MNRAS, 348, L59 [NASA ADS] [CrossRef] [Google Scholar]
- Robertson, B. E., & Ellis, R. S. 2012, ApJ, 744, 95 [NASA ADS] [CrossRef] [Google Scholar]
- Rodríguez Hidalgo, P., Wessels, K., Charlton, J. C., et al. 2012, MNRAS, 427, 1801 [NASA ADS] [CrossRef] [Google Scholar]
- Rossi, A., Klose, S., Ferrero, P., et al. 2012, A&A, 545, A77 [Google Scholar]
- Salvaterra, R., Campana, S., Vergani, S. D., et al. 2012, ApJ, 749, 68 [NASA ADS] [CrossRef] [Google Scholar]
- Savaglio, S., Glazebrook, K., Le Borgne, D., et al. 2005, ApJ, 635, 260 [NASA ADS] [CrossRef] [Google Scholar]
- Savaglio, S., Glazebrook, K., & Le Borgne, D. 2009, ApJ, 691, 182 [NASA ADS] [CrossRef] [MathSciNet] [Google Scholar]
- Schady, P., Dwelly, T., Page, M. J., et al. 2012, A&A, 537, A15 [NASA ADS] [CrossRef] [EDP Sciences] [Google Scholar]
- Schlegel, D. J., Finkbeiner, D. P., & Davis, M. 1998, ApJ, 500, 525 [NASA ADS] [CrossRef] [Google Scholar]
- Skrutskie, M. F., Cutri, R. M., Stiening, R., et al. 2006, AJ, 131, 1163 [NASA ADS] [CrossRef] [Google Scholar]
- Stanek, K. Z., Matheson, T., Garnavich, P. M., et al. 2003, ApJ, 591, L17 [NASA ADS] [CrossRef] [Google Scholar]
- Stanek, K. Z., Gnedin, O. Y., Beacom, J. F., et al. 2006, Acta Astron., 56, 333 [NASA ADS] [Google Scholar]
- Sudilovsky, V., Greiner, J., Rau, A., et al. 2013, A&A, 552, A143 [NASA ADS] [CrossRef] [EDP Sciences] [Google Scholar]
- Tanvir, N. R., Barnard, V. E., Blain, A. W., et al. 2004, MNRAS, 352, 1073 [NASA ADS] [CrossRef] [Google Scholar]
- Tanvir, N. R., Wiersema, K., Levan, A. J., Greiss, S., & Gaensicke, B. 2011, GRB Coordinates Network, 12365, 1 [Google Scholar]
- Tanvir, N. R., Levan, A. J., Fruchter, A. S., et al. 2012, ApJ, 754, 46 [NASA ADS] [CrossRef] [Google Scholar]
- Tody, D. 1993, in Astronomical Data Analysis Software and Systems II, eds. R. J. Hanisch, R. J. V. Brissenden, & J. Barnes, ASP Conf. Ser., 52, 173 [Google Scholar]
- Tremonti, C. A., Heckman, T. M., Kauffmann, G., et al. 2004, ApJ, 613, 898 [NASA ADS] [CrossRef] [Google Scholar]
- Vernet, J., Dekker, H., D’Odorico, S., et al. 2011, A&A, 536, A105 [NASA ADS] [CrossRef] [EDP Sciences] [Google Scholar]
- Wang, F. Y., & Dai, Z. G. 2011, ApJ, 727, L34 [NASA ADS] [CrossRef] [Google Scholar]
- Wigger, C., Wigger, O., Bellm, E., & Hajdas, W. 2008, ApJ, 675, 553 [NASA ADS] [CrossRef] [Google Scholar]
- Wolf, C., & Podsiadlowski, P. 2007, MNRAS, 375, 1049 [NASA ADS] [CrossRef] [Google Scholar]
- Woosley, S. E. 1993, ApJ, 405, 273 [NASA ADS] [CrossRef] [Google Scholar]
- Woosley, S. E., & Heger, A. 2006, ApJ, 637, 914 [NASA ADS] [CrossRef] [Google Scholar]
- Wright, E. L., Eisenhardt, P. R. M., Mainzer, A. K., et al. 2010, AJ, 140, 1868 [NASA ADS] [CrossRef] [Google Scholar]
- Yabe, K., Ohta, K., Iwamuro, F., et al. 2012, PASJ, 64, 60 [NASA ADS] [Google Scholar]
- Yoldaş, A. K., Krühler, T., Greiner, J., et al. 2008, in AIP Conf. Ser., 1000, eds. M. Galassi, D. Palmer, & E. Fenimore, 227 [Google Scholar]
- Yoon, S.-C., & Langer, N. 2005, A&A, 443, 643 [NASA ADS] [CrossRef] [EDP Sciences] [Google Scholar]
- Zahid, H. J., Yates, R. M., Kewley, L. J., & Kudritzki, R. P. 2013, ApJ, 763, 92 [NASA ADS] [CrossRef] [Google Scholar]
All Tables
All Figures
|
Fig. 1 GROND 60-min stacked i′ band image of the GRB 110918A host galaxy. The slit arrangement used in the acquisition image is shown for both the OSIRIS afterglow spectrum (red line) and host spectrum (blue line). |
| In the text | |
|
Fig. 2 Broadband SED of GRB 110918A, including optical, NIR, and X-ray data. The SED was
constructed using GROND data at a mid-time of
T0 + 194 ks and X-ray data between
T0 + 140 ks and
T0 + 250 ks. The best-fit parameters for a power-law
(χ2/d.o.f. = 85/73)
are: a spectral slope of β = 0.70 ± 0.02, a hydrogen column density
of |
| In the text | |
|
Fig. 3 SED of the host of GRB 110918A obtained using GROND, WFI and WISE data, amounting to 11 filters: UBg′r′i′z′JHKsW1W2 from left to right. The best-fit spectrum is depicted in black. |
| In the text | |
|
Fig. 4 Average line-of-sight extinction of the host galaxy vs. the stellar mass. Values from SG09 and MN11 have been converted from E(B − V)gas to E(B − V)stars using the relation from Calzetti et al. (2000). The dotted-black line is the polynomial fit determined by Garn & Best (2010), and the grey region denotes the uncertainty of 0.3 dex. |
| In the text | |
|
Fig. 5 GRB line-of-sight |
| In the text | |
|
Fig. 6 Metallicity determined from the fundamental metallicity relation (taken from MN11) vs. the parametric quantity μ0.32, plotted in grey for a range of SFRs (SFR = 0−100 M⊙ yr-1). Real quantities are plotted for MN11 (magenta squares), GRB 080605 (Krühler et al. 2012a, cyan upward-pointing triangle), and GRB 110918A (red). The host of GRB 110918A is well described by the SDSS-determined FMR. |
| In the text | |
|
Fig. 7 Isotropic-equivalent energy release in γ-rays of GRBs plotted against the gas-phase metallicity of the host galaxy. Blue data are taken from Levesque et al. (2010c). |
| In the text | |
|
Fig. A.1 Afterglow light curve of GRB 110918A obtained with the 7-channel imager GROND (host subtracted). |
| In the text | |
|
Fig. C.1 2D spectra of the host of GRB 110918A depicting four different emissions ([N ii], [O ii], Hα, Hβ). Overplotted is our Gaussian fit, where areas that overlay telluric lines are shown in white and excluded from the fit. All the values presented are raw values and do not include slit-loss or extinction corrections. Each image has been smoothed in both pixel directions for presentation purposes. a) The Balmer series transition Hα; b) the Balmer series transition Hβ; c) the forbidden transition [N ii]; d) the forbidden transition [O ii]. |
| In the text | |
Current usage metrics show cumulative count of Article Views (full-text article views including HTML views, PDF and ePub downloads, according to the available data) and Abstracts Views on Vision4Press platform.
Data correspond to usage on the plateform after 2015. The current usage metrics is available 48-96 hours after online publication and is updated daily on week days.
Initial download of the metrics may take a while.