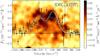
Fig. C.1
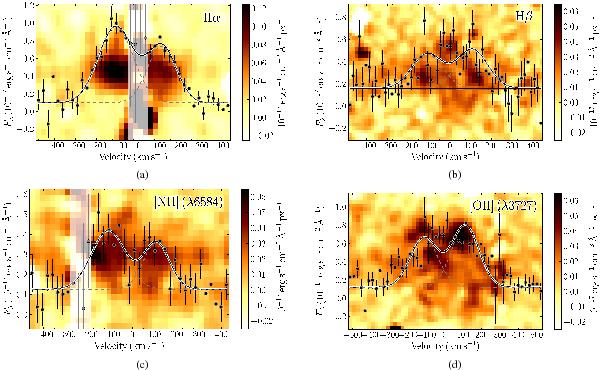
2D spectra of the host of GRB 110918A depicting four different emissions ([N ii], [O ii], Hα, Hβ). Overplotted is our Gaussian fit, where areas that overlay telluric lines are shown in white and excluded from the fit. All the values presented are raw values and do not include slit-loss or extinction corrections. Each image has been smoothed in both pixel directions for presentation purposes. a) The Balmer series transition Hα; b) the Balmer series transition Hβ; c) the forbidden transition [N ii]; d) the forbidden transition [O ii].
Current usage metrics show cumulative count of Article Views (full-text article views including HTML views, PDF and ePub downloads, according to the available data) and Abstracts Views on Vision4Press platform.
Data correspond to usage on the plateform after 2015. The current usage metrics is available 48-96 hours after online publication and is updated daily on week days.
Initial download of the metrics may take a while.