| Issue |
A&A
Volume 519, September 2010
|
|
|---|---|---|
| Article Number | L4 | |
| Number of page(s) | 9 | |
| Section | Letters | |
| DOI | https://doi.org/10.1051/0004-6361/201014719 | |
| Published online | 14 September 2010 | |
LETTER TO THE EDITOR
Herschel![[*]](/icons/foot_motif.png) FIR counterparts of selected Ly
FIR counterparts of selected Ly emitters at z
  2.2
2.2
Fast evolution since z
3 or missed obscured AGNs?
Á. Bongiovanni1,2 - I. Oteo1,2 - J. Cepa2,1 - A. M. Pérez García1,2 - M. Sánchez-Portal3 - A. Ederoclite1,2 - J. A. L. Aguerri1,2 - E. J. Alfaro4 - B. Altieri3 - P. Andreani14 - M. T. Aparicio-Villegas4 - H. Aussel15 - N. Benítez4 - S. Berta13 - T. Broadhurst12 - J. Cabrera-Caño5 - F. J. Castander6 - A. Cava1,2 - M. Cerviño4 - H. Chulani1 - A. Cimatti16 - D. Cristóbal-Hornillos4,9 - E. Daddi15 - H. Dominguez17 - D. Elbaz15 - A. Fernández-Soto10 - N. Förster Schreiber13 - R. Genzel13 - M. F. Gómez1 - R. M. González Delgado4 - A. Grazian17 - C. Gruppioni18 - J. M. Herreros1 - S. Iglesias Groth1,2 - L. Infante11 - D. Lutz13 - B. Magnelli13 - G. Magdis15 - R. Maiolino17 - I. Márquez4 - V. J. Martínez7 - J. Masegosa4 - M. Moles4,9 - A. Molino4 - R. Nordon13 - A. del Olmo4 - J. Perea4 - A. Poglitsch13 - P. Popesso13 - F. Pozzi18 - F. Prada4 - J. M. Quintana4 - L. Riguccini15 - G. Rodighiero19 - A. Saintonge13 - S. F. Sánchez8,9 - P. Santini17 - L. Shao13 - E. Sturm13 - L. Tacconi13 - I. Valtchanov3
1 - Instituto de Astrofísica de Canarias (IAC), 38200 La Laguna,
Tenerife, Spain
2 - Departamento de Astrofísica, Universidad de La Laguna (ULL), 38205
La Laguna, Tenerife, Spain
3 - Herschel Science Centre (ESAC). Villafranca del Castillo, Spain
4 - Instituto de Astrofísica de Andalucía (CSIC), Granada, Spain
5 - Departamento de Física Atómica, Molecular y Nuclear, Facultad de
Física, Universidad de Sevilla, Spain
6 - Institut de Ciències de l'Espai (CSIC), Barcelona, Spain
7 - Departament d'Astronomía i Astrofísica, Universitat de València,
València, Spain
8 - Centro Astronómico Hispano-Alemán, Almería, Spain
9 - Centro de Estudios de Física del Cosmos de Aragón, CEFCA, 44001
Teruel, Spain
10 - Instituto de Física de Cantabria (CSIC-UC), 39005 Santander, Spain
11 - Departamento de Astronomía, Pontificia Universidad Católica,
Santiago, Chile
12 - School of Physics and Astronomy, Tel Aviv University, Israel
13 - Max-Planck-Institut für Extraterrestrische Physik (MPE), Postfach
1312, 85741 Garching, Germany
14 - ESO, Karl-Schwarzschild-Str. 2, 85748 Garching, Germany
15 - Laboratoire AIM, CEA/DSM-CNRS-Université Paris Diderot,
IRFU/Service d'Astrophysique, Bât. 709, CEA-Saclay, 91191
Gif-sur-Yvette Cedex, France
16 - Dipartimento di Astronomia, Università di Bologna, via Ranzani 1,
40127 Bologna, Italy
17 - INAF - Osservatorio Astronomico di Roma, via di Frascati 33, 00040
Monte Porzio Catone, Italy
18 - INAF - Osservatorio Astronomico di Bologna, via Ranzani 1, 40127
Bologna, Italy
19 - Dipartimento di Astronomia, Università di Padova, Vicolo
dell'Osservatorio 3, 35122 Padova, Italy
Received 2 April 2010 / Accepted 3 August 2010
Abstract
Ly![]() emitters (LAEs) are seen everywhere in the redshift domain from local
to
emitters (LAEs) are seen everywhere in the redshift domain from local
to ![]() .
Far-infrared (FIR) counterparts of LAEs at different epochs could
provide direct clues on dust content, extinction, and spectral energy
distribution (SED) for these galaxies. We search for FIR counterparts
of LAEs that are optically detected in the GOODS-North field at
redshift
.
Far-infrared (FIR) counterparts of LAEs at different epochs could
provide direct clues on dust content, extinction, and spectral energy
distribution (SED) for these galaxies. We search for FIR counterparts
of LAEs that are optically detected in the GOODS-North field at
redshift ![]() using data from the Herschel Space Telescope with
the Photodetector Array Camera and Spectrometer (PACS). The LAE
candidates were isolated via color-magnitude diagram using the
medium-band photometry from the ALHAMBRA Survey, ancillary data on
GOODS-North, and stellar population models. According to the fitting of
these spectral synthesis models and FIR/optical diagnostics, most of
them seem to be obscured galaxies whose spectra are AGN-dominated. From
the analysis of the optical data, we have observed a fraction of AGN or
composite over source total number of
using data from the Herschel Space Telescope with
the Photodetector Array Camera and Spectrometer (PACS). The LAE
candidates were isolated via color-magnitude diagram using the
medium-band photometry from the ALHAMBRA Survey, ancillary data on
GOODS-North, and stellar population models. According to the fitting of
these spectral synthesis models and FIR/optical diagnostics, most of
them seem to be obscured galaxies whose spectra are AGN-dominated. From
the analysis of the optical data, we have observed a fraction of AGN or
composite over source total number of ![]() 0.75 in the LAE population at
0.75 in the LAE population at ![]() , which is
marginally consistent with the fraction previously observed at z=2.25
and even at low redshift (
0.2< z
<0.45), but significantly different from the one observed at
redshift
, which is
marginally consistent with the fraction previously observed at z=2.25
and even at low redshift (
0.2< z
<0.45), but significantly different from the one observed at
redshift ![]() 3,
which could be compatible either with a scenario of rapid change in the
AGN fraction between the epochs involved or with a non detection of
obscured AGN in other z=2-3 LAE samples due to lack
of deep FIR observations. We found three robust FIR (PACS) counterparts
at
3,
which could be compatible either with a scenario of rapid change in the
AGN fraction between the epochs involved or with a non detection of
obscured AGN in other z=2-3 LAE samples due to lack
of deep FIR observations. We found three robust FIR (PACS) counterparts
at ![]() in GOODS-North. This demonstrates the possibility of finding dust
emission in LAEs even at higher redshifts.
in GOODS-North. This demonstrates the possibility of finding dust
emission in LAEs even at higher redshifts.
Key words: infrared: galaxies - galaxies: evolution - galaxies: high-redshift
1 Introduction
Ly![]() emitters (LAEs) are found within the more distant baryonic structures
so
far detected in the universe. Like most high-redshift objects, they are
classified
according to the detection technique, a procedure that has generated a
wide
collection of acronyms (EROs, LBGs, SMG, etc.) that are an indication
of our lack
of knowledge of the galaxy evolution processes at high redshift. The
LAEs can be
found at almost any redshift from local (Östlin et al. 2009;
Deharveng et al. 2008)
through
emitters (LAEs) are found within the more distant baryonic structures
so
far detected in the universe. Like most high-redshift objects, they are
classified
according to the detection technique, a procedure that has generated a
wide
collection of acronyms (EROs, LBGs, SMG, etc.) that are an indication
of our lack
of knowledge of the galaxy evolution processes at high redshift. The
LAEs can be
found at almost any redshift from local (Östlin et al. 2009;
Deharveng et al. 2008)
through ![]() (Bouwens et al. 2009;
Iye et al. 2006)
and beyond (e.g. Sobral et al. 2009; Bouwens
et al. 2010),
although LAEs at low redshift (Finkelstein et al. 2009a,d)
show quite different properties from those at z>2.
(Bouwens et al. 2009;
Iye et al. 2006)
and beyond (e.g. Sobral et al. 2009; Bouwens
et al. 2010),
although LAEs at low redshift (Finkelstein et al. 2009a,d)
show quite different properties from those at z>2.
On the high redshift side, LAEs are natural indicators of the
reionization of the universe, although the present evidence goes from
the early
reionization models, which claim that reionization is nearly complete
at ![]() ,
through the late reionization ones, to end around redshift 6.6
(Choudhury & Ferrara 2006),
supported by a number density of LAEs that seem to decrease
beyond
,
through the late reionization ones, to end around redshift 6.6
(Choudhury & Ferrara 2006),
supported by a number density of LAEs that seem to decrease
beyond ![]() (Kobayashi
et al. 2007).
On the low redshift extreme, at
(Kobayashi
et al. 2007).
On the low redshift extreme, at ![]() ,
the
relatively scarce number of LAEs detected could be consistent with them
being
the progenitors of present day L* galaxies. Gawiser et al. (2007)
studied a sample of 162 LAEs at
,
the
relatively scarce number of LAEs detected could be consistent with them
being
the progenitors of present day L* galaxies. Gawiser et al. (2007)
studied a sample of 162 LAEs at ![]() and found neither evidence of dust obscuration nor a substantial AGN
component (of
and found neither evidence of dust obscuration nor a substantial AGN
component (of ![]() 1%)
in the host galaxies, which determines
that their sample is essentially composed of young, low stellar mass
sources without
possible far-infrared (FIR) counterparts. These results agree with
those obtained by Nilsson et al. (2007), who
studied a stacked sample of LAEs at z=3.15.
Nevertheless, there is recent evidence about LAEs with different dust
contents. For instance, Pirzkal et al. (2007) found dusty
but
young LAEs at
1%)
in the host galaxies, which determines
that their sample is essentially composed of young, low stellar mass
sources without
possible far-infrared (FIR) counterparts. These results agree with
those obtained by Nilsson et al. (2007), who
studied a stacked sample of LAEs at z=3.15.
Nevertheless, there is recent evidence about LAEs with different dust
contents. For instance, Pirzkal et al. (2007) found dusty
but
young LAEs at ![]() .
Even more recently, in a study of 170 robust LAE
candidates at z=2.25, Nilsson et al. (2009) found a
trend of apparent evolution in the LAE
properties with respect to their previous work: they detect a
significant AGN contribution and red spectral-energy distributions,
which imply more massive, dustier, and older galaxies than their relatives
at
.
Even more recently, in a study of 170 robust LAE
candidates at z=2.25, Nilsson et al. (2009) found a
trend of apparent evolution in the LAE
properties with respect to their previous work: they detect a
significant AGN contribution and red spectral-energy distributions,
which imply more massive, dustier, and older galaxies than their relatives
at ![]() .
This result is stressed in Nilsson & Møller (2009),
who found that a non-zero fraction of LAEs at z<3
are ULIRGs.
.
This result is stressed in Nilsson & Møller (2009),
who found that a non-zero fraction of LAEs at z<3
are ULIRGs.
Therefore, for a meaningful fraction of LAEs at z=2-3
it
is possible to obtain direct evidence of dust re-emission in FIR
produced by the absorption of UV and optical photons from star-forming
regions or nuclear activity. Additionally, the Ly![]() photons are
resonantly scattered by neutral hydrogen in the galactic ISM,
increasing the
probability that they are totally screened. Because of this, Hayes
et al. (2010)
have recently confirmed that a huge fraction (almost a 90%) of
star-forming galaxies emit insufficient Ly
photons are
resonantly scattered by neutral hydrogen in the galactic ISM,
increasing the
probability that they are totally screened. Because of this, Hayes
et al. (2010)
have recently confirmed that a huge fraction (almost a 90%) of
star-forming galaxies emit insufficient Ly![]() photons to be detected by narrow-band surveys.
photons to be detected by narrow-band surveys.
Even at higher redshift there is evidence of probably dusty
LAEs. Finkelstein et al. (2009b)
performed an analysis of the expected detection of dust emission for
high-z, narrow-band selected LAEs in GOODS Chandra
Deep Field-South (CDF-S). Dust in a fraction of ![]() 0.4 of LAEs with redshift
between 4.1 and 5.8 could be detectable in rest-frame wavelengths of 60
and 100
0.4 of LAEs with redshift
between 4.1 and 5.8 could be detectable in rest-frame wavelengths of 60
and 100
![]() .
This result is reinforced in Finkelstein et al. (2009c) from
a standard SED fitting of LAEs at
.
This result is reinforced in Finkelstein et al. (2009c) from
a standard SED fitting of LAEs at ![]() in the same field.
Additionally, they propose that the bimodality observed in the age
distribution of LAE stellar populations may be owing to dust. With more
conservative results, but using a previously developed Ly
in the same field.
Additionally, they propose that the bimodality observed in the age
distribution of LAE stellar populations may be owing to dust. With more
conservative results, but using a previously developed Ly![]() /continuum
production/transmission model, Dayal et al. (2010) claim to have
found an efficient strategy to look for dust emission from LAEs using
the new developments of ALMA: they suggest that the Ly
/continuum
production/transmission model, Dayal et al. (2010) claim to have
found an efficient strategy to look for dust emission from LAEs using
the new developments of ALMA: they suggest that the Ly![]() and submillimeter emissions (preferentially in the 850
and submillimeter emissions (preferentially in the 850
![]() band) for galaxies at z=(5.7, 6.6; FIR in the LAE
rest-frame) are correlated and, therefore, a
fraction of high-z LAEs (but significantly smaller
than the predicted by Finkelstein et al.
2009c)
could be observed in the submillimeter regime. This could be supported
by the spatial
correlation claimed between SMGs and LAEs, where both populations act
as high density tracers
(Tamura et al. 2009).
Thus, AGN fraction, dust contents, and correlation with FIR data
would help to provide clues for the evolution of LAEs.
band) for galaxies at z=(5.7, 6.6; FIR in the LAE
rest-frame) are correlated and, therefore, a
fraction of high-z LAEs (but significantly smaller
than the predicted by Finkelstein et al.
2009c)
could be observed in the submillimeter regime. This could be supported
by the spatial
correlation claimed between SMGs and LAEs, where both populations act
as high density tracers
(Tamura et al. 2009).
Thus, AGN fraction, dust contents, and correlation with FIR data
would help to provide clues for the evolution of LAEs.
From this brief review, it is clear that the high-z LAE properties are poorly known and on other hand, finding possible counterparts of these objects in the FIR and submillimeter regimes - as we try to demonstrate in this paper - can help to constrain the nature of this apparent duality of LAEs. We present the first results of a multiwavelength analysis of LAE candidates with observations performed with the ESA Herschel Space Observatory (Pilbratt et al. 2010) and the PACS instrument (Poglitsch et al. 2010) in the framework of the PACS Evolutionary Probe (PEP, P.I. D. Lutz). The PEP is the Herschel Guaranteed Time Key-Project designed to obtain the best profit from Herschel instrumentation to study the FIR galaxy population. In our case, only very strong and dusty LAEs could be detected with PACS. Finally, a relative fraction of LAEs hosting AGNs with respect to the overall population is estimated.
Throughout this paper a concordant cosmology with ![]() is assumed.
Unless otherwise specified, all magnitudes are given in the AB system.
is assumed.
Unless otherwise specified, all magnitudes are given in the AB system.
2 Sample selection and ancillary data
2.1 Optical identification of candidate LAEs
We searched for FIR counterparts of LAEs at ![]() in the northeastern
half of the GOODS-North field (
in the northeastern
half of the GOODS-North field (![]() 70 sq-arcmin) by
using selected filters of the ALHAMBRA system
as a part of a more extended study. The Advanced Large Homogeneous Area
Medium-Band Redshift Astronomical (ALHAMBRA) survey is
aimed at providing a tomography of the evolution of the contents of the
universe over
most of their cosmic history (see Moles et al. 2008
for a more detailed description of the survey and its scientific
goals).
This novel approach employs 20 contiguous, equal-width,
70 sq-arcmin) by
using selected filters of the ALHAMBRA system
as a part of a more extended study. The Advanced Large Homogeneous Area
Medium-Band Redshift Astronomical (ALHAMBRA) survey is
aimed at providing a tomography of the evolution of the contents of the
universe over
most of their cosmic history (see Moles et al. 2008
for a more detailed description of the survey and its scientific
goals).
This novel approach employs 20 contiguous, equal-width,
![]() Å top-hat filters
covering from 3500 to 9700 Å plus
the
Johnson-standard JHKs near-infrared (NIR) bands, to
observe a total area of 3.5
Å top-hat filters
covering from 3500 to 9700 Å plus
the
Johnson-standard JHKs near-infrared (NIR) bands, to
observe a total area of 3.5
![]() on the sky (a description of
the ALHAMBRA photometric system is given in Aparicio Villegas
et al. 2010).
The observations were carried out with the Calar Alto 3.5 m
telescope using the wide-field cameras in the
optical, Large Area Imager for Calar Alto (LAICA), and in the NIR,
Omega-2000. The magnitude
limits achieved by ALHAMBRA are AB =
25.5 mag (for an unresolved object, the signal-to-noise ratio S/N=5)
in the optical filters from the blue to 8300 Å, and
from AB = 24.7 to 23.4 for the redder
ones.
The limits in the NIR are in the Vega system
on the sky (a description of
the ALHAMBRA photometric system is given in Aparicio Villegas
et al. 2010).
The observations were carried out with the Calar Alto 3.5 m
telescope using the wide-field cameras in the
optical, Large Area Imager for Calar Alto (LAICA), and in the NIR,
Omega-2000. The magnitude
limits achieved by ALHAMBRA are AB =
25.5 mag (for an unresolved object, the signal-to-noise ratio S/N=5)
in the optical filters from the blue to 8300 Å, and
from AB = 24.7 to 23.4 for the redder
ones.
The limits in the NIR are in the Vega system ![]() mag,
mag, ![]() mag,
and
mag,
and ![]() mag.
mag.
The searching procedure adopted is similar to the well-known
narrow-band techniques used to find high-redshift galaxies (Cowie
& Hu 1998;
Gronwall et al. 2007;
Ouchi et al. 2008;
Shioya et al. 2009;
Murayama et al. 2007),
but instead of a
combination of narrow and broad filters to isolate the line and define
the continuum,
we used selected ALHAMBRA intermediate bandpass filters for both
purposes. Details of the methodology are given in the online
Appendix A.
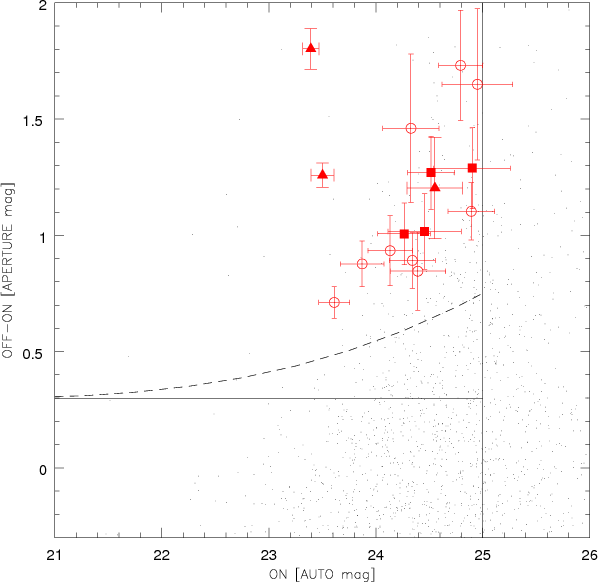
Figure 1
shows a detail of the medium-band color-magnitude distribution for our
catalog of 2532 spurious-free
sources, detected in the northeast fraction of the GOODS-North field.
After applying the color- and limiting magnitude selection criteria
defined in Appendix A,
with an additional 3-![]() color-magnitude restriction (dashed line in Fig. 1), we found 134 raw
LAE candidates. This gives a mean number density of
color-magnitude restriction (dashed line in Fig. 1), we found 134 raw
LAE candidates. This gives a mean number density of ![]()
![]() Mpc-3.
However, without spectroscopic information for a statistically
significant sample of our raw LAE candidates,
these sources were fitted with galaxy templates BC03 (Bruzual &
Charlot 2003),
using the procedure described in Appendix A
to discard the continuum-only objects that show a color excess.
Individual fittings also allow us to obtain reliable photometric
redshifts and preliminary spectral classifications for the raw LAE
candidates. For this purpose, we adopted the photometry from Capak
et al. (2004)
in the optical (UBVRIz') instead of the ALHAMBRA
one. The former data are about 1.1 to 1.5 mag (AB)
deeper in U, B, V,
and R bands than the latter. Not
so for the NIR photometry, where ALHAMBRA data are given in the
canonical bands. After applying this procedure, we combined the results
with an analysis of detection reliability of the Ly
Mpc-3.
However, without spectroscopic information for a statistically
significant sample of our raw LAE candidates,
these sources were fitted with galaxy templates BC03 (Bruzual &
Charlot 2003),
using the procedure described in Appendix A
to discard the continuum-only objects that show a color excess.
Individual fittings also allow us to obtain reliable photometric
redshifts and preliminary spectral classifications for the raw LAE
candidates. For this purpose, we adopted the photometry from Capak
et al. (2004)
in the optical (UBVRIz') instead of the ALHAMBRA
one. The former data are about 1.1 to 1.5 mag (AB)
deeper in U, B, V,
and R bands than the latter. Not
so for the NIR photometry, where ALHAMBRA data are given in the
canonical bands. After applying this procedure, we combined the results
with an analysis of detection reliability of the Ly![]() emission line and found 16 secure
candidates to LAEs, which are represented in the color-magnitude
diagram of Fig. 1
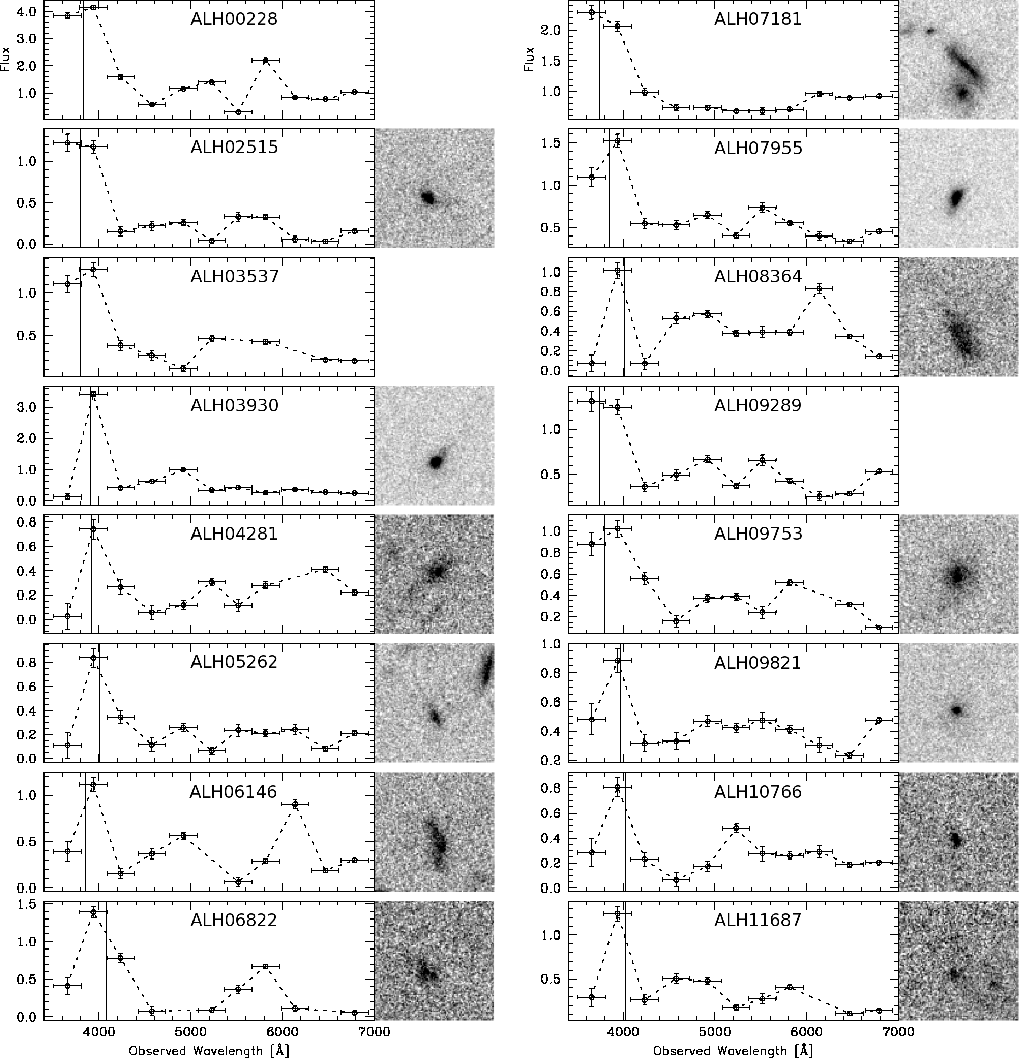
with their corresponding error bars. Optical pseudo-spectra from
ALHAMBRA survey and relevant data of these LAEs, including the
estimated Ly
emission line and found 16 secure
candidates to LAEs, which are represented in the color-magnitude
diagram of Fig. 1
with their corresponding error bars. Optical pseudo-spectra from
ALHAMBRA survey and relevant data of these LAEs, including the
estimated Ly![]() luminosity, are given in online Fig. B.1
and Table B.1,
respectively.
luminosity, are given in online Fig. B.1
and Table B.1,
respectively.
Additionally, each pseudo-spectrum is complemented with a ![]() sq-arcsec
cutout in z-band from HST-ACS (i.e. close to the
UV rest-frame of the source, avoiding possible clumpy features
in the far-UV images), when available. With these data we estimated
sizes and morphologies of the sources from the isophotal radius (2-
sq-arcsec
cutout in z-band from HST-ACS (i.e. close to the
UV rest-frame of the source, avoiding possible clumpy features
in the far-UV images), when available. With these data we estimated
sizes and morphologies of the sources from the isophotal radius (2-![]() above background) and fitted one-component Sérsic profiles using GALFIT
(Peng et al. 2002).
In all cases, this approach converged succesfully. The results of this
analysis are also included in Table B.1.
The LAEs at
above background) and fitted one-component Sérsic profiles using GALFIT
(Peng et al. 2002).
In all cases, this approach converged succesfully. The results of this
analysis are also included in Table B.1.
The LAEs at ![]() have a mean radius of
have a mean radius of ![]() kpc,
except for the objects ALH06146 and ALH07181, which exhibit Sérsic
profiles and residuals that suggest the
presence of bars and out-of-mean radii. Apart from these two objects,
sources in the sample are essentially
compact and their Sérsic indexes are consistent with bulge-like
galaxies.
kpc,
except for the objects ALH06146 and ALH07181, which exhibit Sérsic
profiles and residuals that suggest the
presence of bars and out-of-mean radii. Apart from these two objects,
sources in the sample are essentially
compact and their Sérsic indexes are consistent with bulge-like
galaxies.
|
Figure 1:
Diagnostic diagram of the whole catalog and candidates (see online
Appendix A
for a definition of ON and OFF bands). Continuous lines represent the
basic cut in the color OFF-ON and magnitude in the ON-band. Dashed
curve indicates the 3- |
| Open with DEXTER | |
2.2 Matching candidates with FIR data and modeling
We took advantage of the availability of PACS data on the GOODS-North
field to search for the counterparts of the final LAE sample in the FIR
(100 and 160
![]() PACS bands, with a sensitivity of
PACS bands, with a sensitivity of ![]() 5.1 and
5.1 and ![]() 8.7 mJy at 5-
8.7 mJy at 5-![]() ,
respectively) by using the PEP Science Demonstration Phase (SDP)
catalog with MIPS-24
,
respectively) by using the PEP Science Demonstration Phase (SDP)
catalog with MIPS-24
![]() based position priors (Berta et al. 2010). We performed
a match between the catalogs to find which candidates have a detected
FIR source closer than
1.5 arcsecs (in the order of the pixel size at
100
based position priors (Berta et al. 2010). We performed
a match between the catalogs to find which candidates have a detected
FIR source closer than
1.5 arcsecs (in the order of the pixel size at
100
![]() ), and thus study the
resulting sample with the aid of spectral synthesis templates from
Polletta et al. (2007)
for star-forming (SF) and AGN/Composite (AGN/C) objects, but adding the
FIR fluxes to the photometric data set previously used. In this
preliminary analysis we did not use mid-infrared (MIR) data from Spitzer-IRAC
because not all the LAE candidates were detected in the raw images.
Even so, the IRAC-bands fluxes using ALHAMBRA
), and thus study the
resulting sample with the aid of spectral synthesis templates from
Polletta et al. (2007)
for star-forming (SF) and AGN/Composite (AGN/C) objects, but adding the
FIR fluxes to the photometric data set previously used. In this
preliminary analysis we did not use mid-infrared (MIR) data from Spitzer-IRAC
because not all the LAE candidates were detected in the raw images.
Even so, the IRAC-bands fluxes using ALHAMBRA ![]() -band catalog as priors, with
the same aperture set, will be included in a forthcoming analysis of
PEP data (Oteo et al., in prep.)
-band catalog as priors, with
the same aperture set, will be included in a forthcoming analysis of
PEP data (Oteo et al., in prep.)
We found that seven out of 16 LAEs are detected in MIPS
24
![]() band, of which three were also detected at 100 and/or 160
band, of which three were also detected at 100 and/or 160
![]() bands of PACS. The best-fit for one source of our sample of LAEs with
MIPS-24
bands of PACS. The best-fit for one source of our sample of LAEs with
MIPS-24
![]() counterparts corresponds to a SF-like template, and the remaining six
sources were well fitted with AGN/Composite ones. The
LAEs with FIR counterparts in PACS data belong to the latter group, and
in the following discussion we only
consider those galaxies, unless otherwise specified. The fluxes of the
sources in FIR as well as the final spectral classification derived
from the best-fitting templates are given in Table B.1.
We also distinguished these LAEs in the color-magnitude distribution
given in Fig. 1.
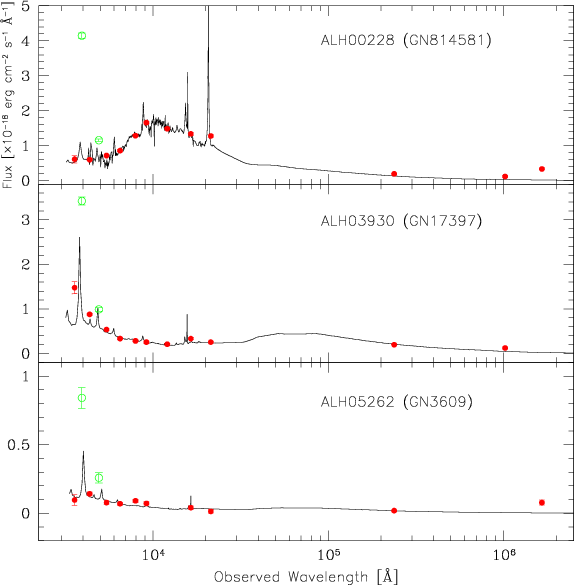
Likewise, the best-fitted spectra for the LAEs with FIR counterparts in
PACS data,
corresponding to the objects identified as ALH00228, ALH03930 (with
spectroscopic redshift), and ALH05262, are represented in Fig. 2. The best
fitting obtained for the first object corresponds to an AGN-1/Composite
spectrum, while the other two were fitted using AGN-2/Composite ones.
As a consistency test, we compared the
counterparts corresponds to a SF-like template, and the remaining six
sources were well fitted with AGN/Composite ones. The
LAEs with FIR counterparts in PACS data belong to the latter group, and
in the following discussion we only
consider those galaxies, unless otherwise specified. The fluxes of the
sources in FIR as well as the final spectral classification derived
from the best-fitting templates are given in Table B.1.
We also distinguished these LAEs in the color-magnitude distribution
given in Fig. 1.
Likewise, the best-fitted spectra for the LAEs with FIR counterparts in
PACS data,
corresponding to the objects identified as ALH00228, ALH03930 (with
spectroscopic redshift), and ALH05262, are represented in Fig. 2. The best
fitting obtained for the first object corresponds to an AGN-1/Composite
spectrum, while the other two were fitted using AGN-2/Composite ones.
As a consistency test, we compared the ![]() /
/
![]() ratios
for the objects ALH00228 and ALH03930
(
ratios
for the objects ALH00228 and ALH03930
(
![]() and
and ![]() ,
respectively) with the AGN/SB diagnostic predictions of Mullaney
et al. (2010)
for PACS filters. These sources fall on the average region (at z=2.2)
of AGN composed with SBs.
,
respectively) with the AGN/SB diagnostic predictions of Mullaney
et al. (2010)
for PACS filters. These sources fall on the average region (at z=2.2)
of AGN composed with SBs.
Finally, we matched the final LAE catalog with the X-ray data of Chandra/GOODS-North from Alexander et al. (2003). We found only one counterpart (object ALH08364) in this catalog, whose best-fitted template correspond to AGN/Composite.
|
Figure 2:
Best-model fitting of the final LAE candidates at |
| Open with DEXTER | |
3 Results and discussion
We found 134 raw candidates at a mean redshift of 2.2 in the northeastern half of GOODS-North field, using color-magnitude diagnostics of selected medium-band data from ALHAMBRA survey. From this sample, we segregated 16 robust LAEs using spectral synthesis templates. 75% of the final sample were well fitted with AGN/Composite templates, whereas the remaining galaxies were star-forming. Likewise, almost half of the LAEs detected atFrom the analysis of available images of HST-ACS in z-band
(rest-frame UV), the LAEs at ![]() can be
described as mainly compact (2 out of 16 of barred
morphology), with a typical isophotal radius of
can be
described as mainly compact (2 out of 16 of barred
morphology), with a typical isophotal radius of ![]() 1.7 kpc.
This
finding is consistent with the dominant morphology in the LAE sample at
z=3.1 analyzed by Bond et al. (2009), but
with sizes larger by a factor
1.7 kpc.
This
finding is consistent with the dominant morphology in the LAE sample at
z=3.1 analyzed by Bond et al. (2009), but
with sizes larger by a factor ![]() 2.
2.
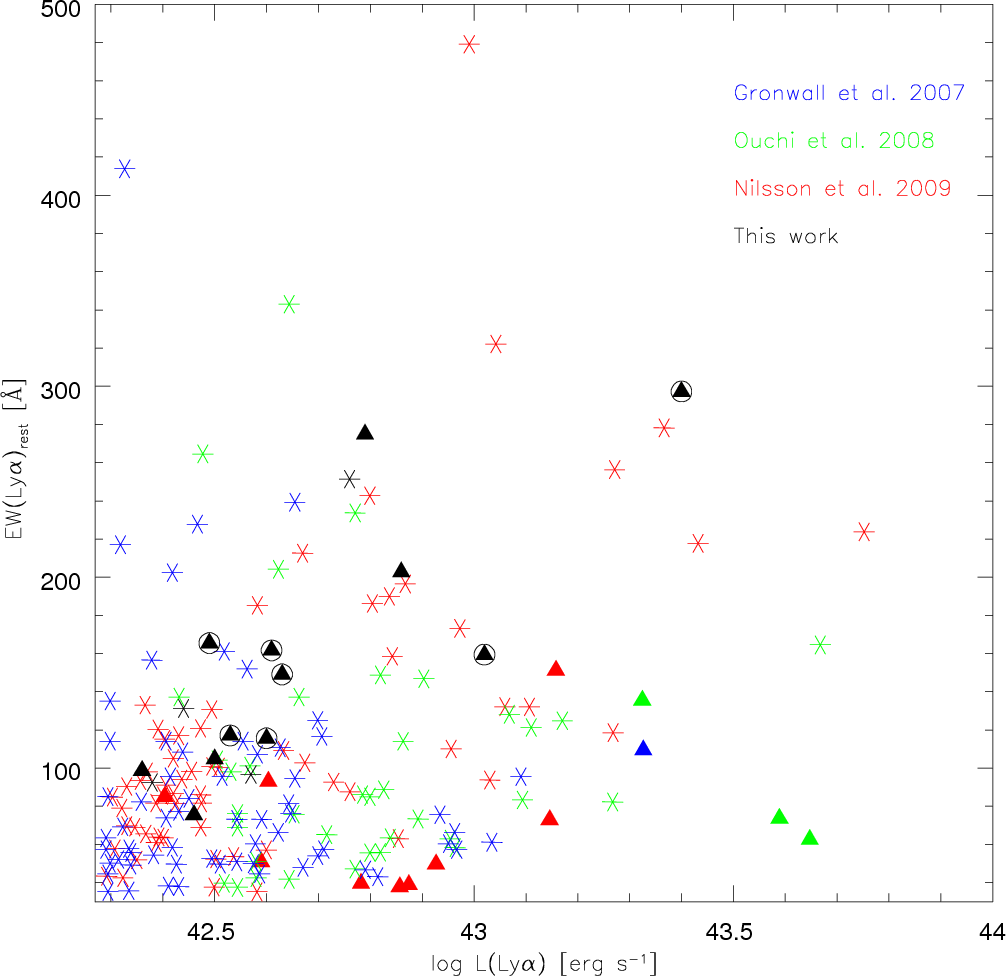
At Ly![]() luminosity and rest-frame EW limits of
luminosity and rest-frame EW limits of
![]() erg s-1
and 35
erg s-1
and 35 ![]() ,
respectively, and under the cosmological assumptions stated in
Sect. 1,
we compared our LAE sample of possible AGNs with those from recently
published data at z=2.25 of Nilsson et al.
(2009). To
search for possible evolutionary effects on the AGN fraction, we also
analyzed the LAE samples of Gronwall et al. (2007) and Ouchi
et al. (2008),
both at z=3.1. The AGN-to-total fraction for each
sample is given in Table B.2. The
position of each source of these samples in the previously defined EW-luminosity
space is shown in Fig. B.2. From
these data it is clear that the AGN fraction increased by a factor
of 2.5 (Nilsson et al. 2009) to 15 (this
work) between both epochs (
,
respectively, and under the cosmological assumptions stated in
Sect. 1,
we compared our LAE sample of possible AGNs with those from recently
published data at z=2.25 of Nilsson et al.
(2009). To
search for possible evolutionary effects on the AGN fraction, we also
analyzed the LAE samples of Gronwall et al. (2007) and Ouchi
et al. (2008),
both at z=3.1. The AGN-to-total fraction for each
sample is given in Table B.2. The
position of each source of these samples in the previously defined EW-luminosity
space is shown in Fig. B.2. From
these data it is clear that the AGN fraction increased by a factor
of 2.5 (Nilsson et al. 2009) to 15 (this
work) between both epochs (
![]() Gyr), assuming a
mean AGN fraction at z=3.1 of 0.05. This
result would suggest a rapid evolution scenario of LAEs classified as
AGNs between
Gyr), assuming a
mean AGN fraction at z=3.1 of 0.05. This
result would suggest a rapid evolution scenario of LAEs classified as
AGNs between ![]() and 3. Wolf et al. (2003) found a peak
in the comoving AGN space density at
and 3. Wolf et al. (2003) found a peak
in the comoving AGN space density at ![]() ,
but our prima facie evidence points to an evolutionary behavior that
qualitatively exceeds the one reported by them. Additionally, our
AGN-to-total ratio in the LAE population at
,
but our prima facie evidence points to an evolutionary behavior that
qualitatively exceeds the one reported by them. Additionally, our
AGN-to-total ratio in the LAE population at ![]() is marginally consistent with that observed at low redshift (of 0.435
at 0.2 <z<0.45,
Finkelstein et al. 2009a).
Note that the AGNs in the samples used for comparison purposes have
been classified as such because of the X-ray detection whereas in our
case, the lack of detection of FIR counterparts in X-rays (Chandra/GOODS-North,
Alexander et al. 2003)
suggests that these sources are obscured AGNs. Consistently, at
is marginally consistent with that observed at low redshift (of 0.435
at 0.2 <z<0.45,
Finkelstein et al. 2009a).
Note that the AGNs in the samples used for comparison purposes have
been classified as such because of the X-ray detection whereas in our
case, the lack of detection of FIR counterparts in X-rays (Chandra/GOODS-North,
Alexander et al. 2003)
suggests that these sources are obscured AGNs. Consistently, at ![]() the FIR emission between 30 to
the FIR emission between 30 to ![]() 110
110
![]() (rest-frame) could be attributed to the re-emission of the dust heated
by either the active nucleus or starburst regions close to the nucleus
(i.e. a warm dust component; Pérez García
et al. 1998).
If only X-ray detected AGN were considered, the fraction of active
nuclei within our sample would be reduced to
(rest-frame) could be attributed to the re-emission of the dust heated
by either the active nucleus or starburst regions close to the nucleus
(i.e. a warm dust component; Pérez García
et al. 1998).
If only X-ray detected AGN were considered, the fraction of active
nuclei within our sample would be reduced to ![]() 0.16, i.e. compatible with no
evolution from the
0.16, i.e. compatible with no
evolution from the ![]() samples.
samples.
As an alternative to the presented evolutionary scenario, one
could suggest the presence of some kind of selection effect.
As shown in Fig. B.2,
the sources of our whole LAE sample with ![]() Ly
Ly
![]() .5 have rest-frame EWs
a factor of 2-3 higher than the corresponding objects in the
sample of Nilsson et al. (2009)
at the same redshift. A possible explanation for this effect is that
our ON-filter could favor the selection of broad emission-line objects,
but this does not clarify the absence of AGNs with rest-frame EWs
above
.5 have rest-frame EWs
a factor of 2-3 higher than the corresponding objects in the
sample of Nilsson et al. (2009)
at the same redshift. A possible explanation for this effect is that
our ON-filter could favor the selection of broad emission-line objects,
but this does not clarify the absence of AGNs with rest-frame EWs
above ![]() 150
150 ![]() in the
latter.
in the
latter.
This assertion is strengthened by the evidence of the CIV![]() 1549
redshifted emission line in the ALHAMBRA optical pseudo-spectra of
these sources (observed through the filter A491M),
apart from the photometric signature of the Ly
1549
redshifted emission line in the ALHAMBRA optical pseudo-spectra of
these sources (observed through the filter A491M),
apart from the photometric signature of the Ly![]() emission, as shown
in Fig. 2.
Moreover, the
emission, as shown
in Fig. 2.
Moreover, the ![]() colors
and
colors
and ![]() /
/![]() (R) ratios
(see Table B.1)
of the FIR counterparts of our LAE sample give preliminary evidence
about
the degree of obscuration: many of our sources could host moderately to
highly obscured AGNs, according to the criteria
extensively discussed in Fiore et al. (2008), if the
approximation K-band
(R) ratios
(see Table B.1)
of the FIR counterparts of our LAE sample give preliminary evidence
about
the degree of obscuration: many of our sources could host moderately to
highly obscured AGNs, according to the criteria
extensively discussed in Fiore et al. (2008), if the
approximation K-band ![]()
![]() is allowed. Thus,
returning to the dicothomy previously raised and apart from the
possible evolution of the AGN fraction between
redshifts 2 and 3, one might consider that some
sources at z=2-3, classified as LAEs by different
authors, are also obscured AGNs.
is allowed. Thus,
returning to the dicothomy previously raised and apart from the
possible evolution of the AGN fraction between
redshifts 2 and 3, one might consider that some
sources at z=2-3, classified as LAEs by different
authors, are also obscured AGNs.
This work was supported by the Spanish Plan Nacional de Astrononomía y Astrofísica under grants AYA2008-06311-C02-01 and AYA2006-14056. Based on observations collected at the German-Spanish Astronomical Center, Calar Alto, jointly operated by the Max-Planck-Institut für Astronomie, Heidelberg and the Instituto de Astrofísica de Andalucía (CSIC). PACS has been developed by a consortium of institutes led by MPE (Germany) and including UVIE (Austria); KUL, CSL, IMEC (Belgium); CEA, OAMP (France); MPIA (Germany); IFSI, OAP/AOT, OAA/CAISMI, LENS, SISSA (Italy); IAC (Spain). This development has been supported by the funding agencies BMVIT (Austria), ESA-PRODEX (Belgium), CEA/CNES (France), DLR (Germany), ASI (Italy) and CICYT/MICINN (Spain). We thanks the anonymous referee for valuable comments, which have contributed significatively to the manuscript improvement.
References
- Alexander, D. M., Bauer, F. E., Brandt, W. N., et al. 2003, AJ, 126, 539 [NASA ADS] [CrossRef] [Google Scholar]
- Aparicio Villegas, T., Alfaro, E. J., Cabrera-Caño, J., et al. 2010, AJ, 139, 1242 [NASA ADS] [CrossRef] [Google Scholar]
- Barger, A. J., Cowie, L. L., & Wang, W.-H. 2008, ApJ, 689, 687 [NASA ADS] [CrossRef] [Google Scholar]
- Berta, S., Magnelli, B., Lutz, D., et al. 2010, A&A, 518, L30 [NASA ADS] [CrossRef] [EDP Sciences] [Google Scholar]
- Bertin, E., & Arnouts, S. 1996, A&AS, 117, 393 [NASA ADS] [CrossRef] [EDP Sciences] [Google Scholar]
- Bond, N. A., Gawiser, E., Gronwall, C., et al. 2009, ApJ, 705, 639 [NASA ADS] [CrossRef] [Google Scholar]
- Bouwens, R. J., Illingworth, G. D., Bradley, L. D., et al. 2009, ApJ, 690, 1764 [NASA ADS] [CrossRef] [Google Scholar]
- Bouwens, R. J., Illingworth, G. D., Oesch, P. A., et al. 2010, ApJ, 709, 133 [Google Scholar]
- Bruzual, G., & Charlot, S. 2003, MNRAS, 344, 1000 [NASA ADS] [CrossRef] [Google Scholar]
- Capak, P., Cowie, L. L., Hu, E. M., et al. 2004, AJ, 127, 180 [NASA ADS] [CrossRef] [Google Scholar]
- Chary, R., & Elbaz, D. 2001, ApJ, 556, 562 [NASA ADS] [CrossRef] [Google Scholar]
- Choudhury, T. R., & Ferrara, A. 2006, MNRAS, 371, L55 [NASA ADS] [CrossRef] [Google Scholar]
- Cowie, L. L., & Hu, E. M. 1998, AJ, 115, 1319 [NASA ADS] [CrossRef] [Google Scholar]
- Dayal, P., Hirashita, H., & Ferrara, A. 2010, MNRAS, 403, 620 [NASA ADS] [CrossRef] [Google Scholar]
- Deharveng, J.-M., Small, T., Barlow, T. A., et al. 2008, ApJ, 680, 1072 [NASA ADS] [CrossRef] [Google Scholar]
- Finkelstein, S. L., Cohen, S. H., Malhotra, S., et al. 2009a, ApJ, 703, L162 [NASA ADS] [CrossRef] [Google Scholar]
- Finkelstein, S. L., Malhotra, S., Rhoads, J. E., Hathi, N. P., & Pirzkal, N. 2009b, MNRAS, 393, 1174 [NASA ADS] [CrossRef] [Google Scholar]
- Finkelstein, S. L., Rhoads, J. E., Malhotra, S., & Grogin, N. 2009c, ApJ, 691, 465 [NASA ADS] [CrossRef] [Google Scholar]
- Finkelstein, S. L., Cohen, S. H., Malhotra, S., & Rhoads, J. E. 2009d, ApJ, 700, 276 [NASA ADS] [CrossRef] [Google Scholar]
- Fiore, F., Grazian, A., Santini, P., et al. 2008, ApJ, 672, 94 [NASA ADS] [CrossRef] [Google Scholar]
- Gawiser, E., Francke, H., Lai, K., et al. 2007, ApJ, 671, 278 [NASA ADS] [CrossRef] [Google Scholar]
- Gronwall, C., Ciardullo, R., Hickey, T., et al. 2007, ApJ, 667, 79 [NASA ADS] [CrossRef] [Google Scholar]
- Guaita, L., Gawiser, E., Padilla, N., et al. 2010, ApJ, 714, 255 [NASA ADS] [CrossRef] [Google Scholar]
- Hayes, M., Östlin, G., Schaerer, D., et al. 2010, Nature, 464, 562 [NASA ADS] [CrossRef] [PubMed] [Google Scholar]
- Iye, M., Ota, K., Kashikawa, N., et al. 2006, Nature, 443, 186 [NASA ADS] [CrossRef] [PubMed] [Google Scholar]
- Kobayashi, M. A. R., Totani, T., & Nagashima, M. 2007, ApJ, 670, 919 [NASA ADS] [CrossRef] [Google Scholar]
- Moles, M., Benítez, N., Aguerri, J. A. L., et al. 2008, AJ, 136, 1325 [Google Scholar]
- Mullaney, J. R., Alexander, D. M., Huynh, M., Goulding, A. D., & Frayer, D. 2010, MNRAS, 401, 995 [NASA ADS] [CrossRef] [Google Scholar]
- Nilsson, K. K., & Møller, P. 2009, A&A, 508, L21 [NASA ADS] [CrossRef] [EDP Sciences] [Google Scholar]
- Nilsson, K. K., Møller, P., Möller, O., et al. 2007, A&A, 471, 71 [NASA ADS] [CrossRef] [EDP Sciences] [Google Scholar]
- Nilsson, K. K., Pietsch, W., Sala, G., et al. 2009, A&A, 498, 13 [NASA ADS] [CrossRef] [EDP Sciences] [Google Scholar]
- Murayama, T., Taniguchi, Y., Scoville, N. Z., et al. 2007, ApJS, 172, 523 [NASA ADS] [CrossRef] [Google Scholar]
- Östlin, G., Hayes, M., Kunth, D., et al. 2009, AJ, 138, 923 [NASA ADS] [CrossRef] [Google Scholar]
- Ouchi, M., Shimasaku, K., Akiyama, M., et al. 2008, ApJS, 176, 301 [NASA ADS] [CrossRef] [Google Scholar]
- Peng, C. Y., Ho, L. C., Impey, C. D., & Rix, H.-W. 2002, AJ, 124, 266 [NASA ADS] [CrossRef] [Google Scholar]
- Pérez García, A. M., Rodríguez, E. J. M., & Santolaya, R. E. 1998, ApJ, 500, 685 [NASA ADS] [CrossRef] [Google Scholar]
- Pilbratt, G., Riedinger, J. R., Passvogel, T., et al. 2010, A&A, 518, L1 [CrossRef] [EDP Sciences] [Google Scholar]
- Pirzkal, N., Malhotra, S., Rhoads, J. E., & Xu, C. 2007, ApJ, 667, 49 [NASA ADS] [CrossRef] [Google Scholar]
- Polletta, M., Tajer, M., Maraschi, L., et al. 2007, ApJ, 663, 81 [NASA ADS] [CrossRef] [Google Scholar]
- Poglitsch, A., Waelkens, C., Geis, N., et al. 2010, A&A, 518, L2 [NASA ADS] [CrossRef] [EDP Sciences] [Google Scholar]
- Popesso, P., Dickinson, M., Nonino, M., et al. 2009, A&A, 494, 443 [NASA ADS] [CrossRef] [EDP Sciences] [Google Scholar]
- Shioya, Y., Taniguchi, Y., Sasaki, S. S., et al. 2009, ApJ, 696, 546 [NASA ADS] [CrossRef] [Google Scholar]
- Sobral, D., Best, P., Geach, J., et al. 2009 [arXiv:0911.4861] [Google Scholar]
- Tamura, Y., Kohno, K., Nakanishi, K., et al. 2009, Nature, 459, 61 [NASA ADS] [CrossRef] [PubMed] [Google Scholar]
- Wolf, C., Wisotzki, L., Borch, A., et al. 2003, A&A, 408, 499 [NASA ADS] [CrossRef] [EDP Sciences] [Google Scholar]
Online Material
Appendix A: Photometric selection of z 2.2
LAE candidates from ALHAMBRA survey in GOODS-North
The method used for finding LAEs is based on a color-magnitude
diagnostic diagram.
The filter which samples the emission line is the ON filter and those
used to define the continuum constitute the OFF filters set. The choice
of the ON filter determines the range where the redshifts of the
candidates will be. In this way, we seleted the LAE candidates at
2.10<z<2.37 by using the filters
A394M as ON filter (owing to the official naming of
ALHAMBRA filters, the number between letters
gives the rounded central wavelength in nanometers; the last letter is
the acronym of ``Medium'' bandpass),
and a sum of A425M and A457M as
OFF filters, in order to increase the S/N
in the continuum.
Figure A.1
(inset) shows the
transmission curve of the chosen filters for LAE selection. Assuming an
effective filter width equal
to its FWHM, and taking into account the sky area
surveyed, as well as the emission line of interest, we
have explored in this way a comoving volume of about ![]() .
.
|
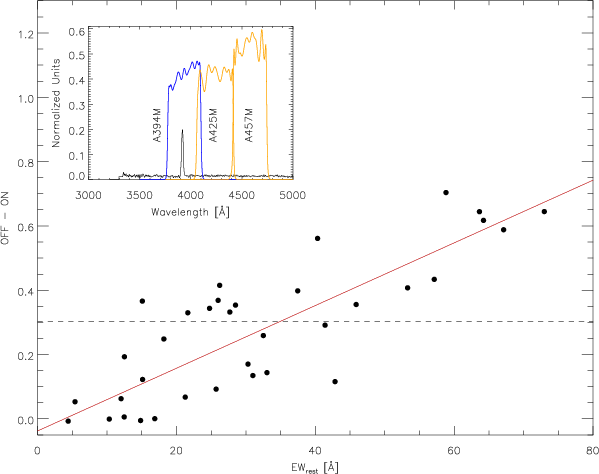
Figure A.1:
ALHAMBRA expected OFF-ON color of the VIMOS LAEs spectra at |
| Open with DEXTER | |
Once the ON and OFF filters were chosen, and according with the
ALHAMBRA survey sensitivity, we adopt a
limiting magnitude of 25.0 in the ON-band. Then, we elaborated
a color selection criterion to find LAEs
as efficiently as possible. We used the data from the GOODS/VIMOS
Spectroscopy DR 2.0.1
(Popesso et al. 2009)
to simulate the behavior of the SED from a typical LAE against the
selected
ALHAMBRA filters. From the whole spectroscopic catalog we selected the
objects that show a line which corresponds to a Ly![]() emission. Then the spectra were de-redshifted
so that the central wavelength of the lines were
within the transmission range of the ON filterin each case, as shown in
the example of Fig. A.1,
and
their rest frame equivalent widths were calculated. After this we were
able to compute the OFF-ON color by convolution of the filter profiles
with
each spectrum. In Fig. A.1
we represent this
color against the rest frame equivalent width of the lines, measured
with splot in IRAF.
As can be seen, there exists a relation between both variables, which
allows us to define a color selection
criterion. Our LAE candidates were selected to have rest-frame
equivalent widths
emission. Then the spectra were de-redshifted
so that the central wavelength of the lines were
within the transmission range of the ON filterin each case, as shown in
the example of Fig. A.1,
and
their rest frame equivalent widths were calculated. After this we were
able to compute the OFF-ON color by convolution of the filter profiles
with
each spectrum. In Fig. A.1
we represent this
color against the rest frame equivalent width of the lines, measured
with splot in IRAF.
As can be seen, there exists a relation between both variables, which
allows us to define a color selection
criterion. Our LAE candidates were selected to have rest-frame
equivalent widths
![]() .
According to Fig. A.1,
this value corresponds to a
threshold color of approximately 0.3 for both filter pairs. But taking
into account the photometric
errors, our adopted color selection criterion is
.
According to Fig. A.1,
this value corresponds to a
threshold color of approximately 0.3 for both filter pairs. But taking
into account the photometric
errors, our adopted color selection criterion is
![]() .
This translates the minimum rest-frame equivalent
width to
.
This translates the minimum rest-frame equivalent
width to ![]() at the limiting magnitude in the ON-band, corresponding
to Ly
at the limiting magnitude in the ON-band, corresponding
to Ly![]() luminosities of
luminosities of ![]() erg s-1
at z=2.2.
erg s-1
at z=2.2.
All photometric measures were performed with SExtractor (Bertin & Arnouts 1996) on the full processed and stacked images of the field ALHAMBRA-5, pointing 1. To calculate the color we used three arcsec aperture magnitudes and MAG_AUTO ones to plot the magnitudes of the objects. Sources with SExtractor nonzero flags were discarded.
In order to study the nature of the possible continuum
contaminants we carried out simulations with galaxy templates
of BC03 (Bruzual & Charlot 2003)
and SWIRE (Polletta et al. 2007). We took
all the templates and redshifted them from z=0
to 3 in bins of
![]() .
We calculated their expected color and checked whether they satisfy the
color
selection criterion. As a result, we found that the contaminants appear
to be mainly starburst galaxies
at
.
We calculated their expected color and checked whether they satisfy the
color
selection criterion. As a result, we found that the contaminants appear
to be mainly starburst galaxies
at ![]() ,
whose UV rest-frame drop is sampled with the filters. As an example,
Fig. A.2
shows a set of spectra of different starburst templates that satisfy
the color criterium, although they are false positive candidates. More
details
of this study are included in a forthcoming paper (Oteo
et al., in prep.).
,
whose UV rest-frame drop is sampled with the filters. As an example,
Fig. A.2
shows a set of spectra of different starburst templates that satisfy
the color criterium, although they are false positive candidates. More
details
of this study are included in a forthcoming paper (Oteo
et al., in prep.).
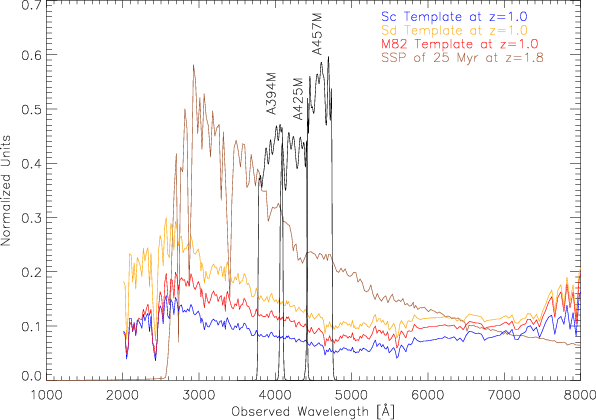
|
Figure A.2: Spectra of possible contaminants. The transmission curves of the filter set used to select LAEs and spectra of possible contaminants at different redshifts, built from BC03 and SWIRE templates, are shown. The main contaminants are those whose UV continuum slope is sampled by the filters, resulting in the appearance of false-positive candidates. For the sake of clarity, the spectra and the transmission of the filters have been scaled. |
| Open with DEXTER | |
Appendix B: Data of z 2.2
LAE candidates in GOODS-North
|
Figure B.1:
Optical pseudo-spectra of |
| Open with DEXTER | |
Table B.1:
Combined data list of ![]() LAE candidates in the north-east half of the GOODS-North field.
LAE candidates in the north-east half of the GOODS-North field.
Table B.2:
Number counts of LAEs redshifts 2.2 and 3.1, limited in Ly![]() luminosity and rest-frame EW.
luminosity and rest-frame EW.
|
Figure B.1:
Rest-frame EW against Ly |
| Open with DEXTER | |
Footnotes
- ...Herschel
- Herschel is an ESA space observatory with science instruments provided by European-led Principal Investigator consortia and with important participation from NASA.
- ... AGNs?
- Appendices (pages 6 to 9) are only available in electronic form at http://www.aanda.org
All Tables
Table B.1:
Combined data list of ![]() LAE candidates in the north-east half of the GOODS-North field.
LAE candidates in the north-east half of the GOODS-North field.
Table B.2:
Number counts of LAEs redshifts 2.2 and 3.1, limited in Ly![]() luminosity and rest-frame EW.
luminosity and rest-frame EW.
All Figures
|
|
Figure 1:
Diagnostic diagram of the whole catalog and candidates (see online
Appendix A
for a definition of ON and OFF bands). Continuous lines represent the
basic cut in the color OFF-ON and magnitude in the ON-band. Dashed
curve indicates the 3- |
| Open with DEXTER | |
| In the text | |
|
|
Figure 2:
Best-model fitting of the final LAE candidates at |
| Open with DEXTER | |
| In the text | |
|
|
Figure A.1:
ALHAMBRA expected OFF-ON color of the VIMOS LAEs spectra at |
| Open with DEXTER | |
| In the text | |
|
|
Figure A.2: Spectra of possible contaminants. The transmission curves of the filter set used to select LAEs and spectra of possible contaminants at different redshifts, built from BC03 and SWIRE templates, are shown. The main contaminants are those whose UV continuum slope is sampled by the filters, resulting in the appearance of false-positive candidates. For the sake of clarity, the spectra and the transmission of the filters have been scaled. |
| Open with DEXTER | |
| In the text | |
|
|
Figure B.1:
Optical pseudo-spectra of |
| Open with DEXTER | |
| In the text | |
|
|
Figure B.1:
Rest-frame EW against Ly |
| Open with DEXTER | |
| In the text | |
Copyright ESO 2010
Current usage metrics show cumulative count of Article Views (full-text article views including HTML views, PDF and ePub downloads, according to the available data) and Abstracts Views on Vision4Press platform.
Data correspond to usage on the plateform after 2015. The current usage metrics is available 48-96 hours after online publication and is updated daily on week days.
Initial download of the metrics may take a while.