| Issue |
A&A
Volume 584, December 2015
|
|
|---|---|---|
| Article Number | A86 | |
| Number of page(s) | 19 | |
| Section | Stellar atmospheres | |
| DOI | https://doi.org/10.1051/0004-6361/201526695 | |
| Published online | 25 November 2015 | |
Online material
Appendix A: Line lists
Fe and Ti lines adopted: species, wavelength (Å), excitation potential (eV), oscillator strengths from VALD and NIST, measured equivalent widths EWs (mÅ), errors on the EWs, resulting abundances and associated errors.
Line list used in the present analysis: species, wavelength (Å), oscillator strengths, excitation potential (eV), and resulting abundances line by line.
Hyperfine coupling constants for the lines retained in this analysis.
Appendix B: Figures of spectral synthesis
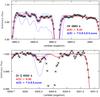 |
Fig. B.1
LTE nitrogen abundance in HD 140283 from CN(0, 0) bandhead at 3883 Å (upper panel) and LTE oxygen abundance from [O i] 6300.31 Å line (lower panel). Symbols are the same as in Fig. 3. |
| Open with DEXTER | |
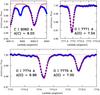 |
Fig. B.2
NLTE carbon abundance in HD 140283 from C i 9062.48 Å line (upper left panel) and NLTE oxygen abundance from the red O i triplet: 7771.94 Å (upper right panel), 7774.16 Å, and 7775.39 Å (lower panel) lines. Observations (blue circles) are compared with synthetic spectra computed with the adopted abundances (red solid lines). |
| Open with DEXTER | |
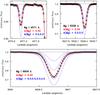 |
Fig. B.3
LTE magnesium abundance in HD 140283 from Mg i 4571.10 Å (upper left panel), Mg i 5528.40 Å (upper right panel), and Mg i 8806.76 Å (lower panel) lines. Symbols are the same as in Fig. 3. |
| Open with DEXTER | |
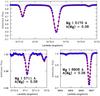 |
Fig. B.4
NLTE magnesium abundance in HD 140283 from Mg i 5172.68 Å (upper panel), Mg i 5711.09 Å (lower left panel), and Mg i 8806.76 Å (lower right panel) lines. Symbols are the same as in Fig. B.2. |
| Open with DEXTER | |
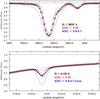 |
Fig. B.5
LTE silicon abundance in HD 140283 from Si i 3905.52 Å (upper panel) and Si i 4102.936 Å (lower panel) lines. Symbols are the same as in Fig. 3. |
| Open with DEXTER | |
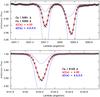 |
Fig. B.6
LTE calcium abundance in HD 140283 from Ca i 5261.70 Å, Ca i 5262.24 Å (upper panel), and Ca i 6122.23 Å (lower panel) lines. Symbols are the same as in Fig. 3. |
| Open with DEXTER | |
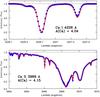 |
Fig. B.7
NLTE calcium abundance in HD 140283 from Ca i 4226.73 Å (upper panel) and Ca ii 3968.47 Å (lower panel) lines. Symbols are the same as in Fig. B.2. |
| Open with DEXTER | |
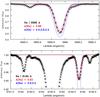 |
Fig. B.8
LTE sodium abundance in HD 140283 from Na i 5895.92 Å (upper panel) and Na i 8194.82 Å (lower panel) lines. Symbols are the same as in Fig. 3. |
| Open with DEXTER | |
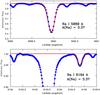 |
Fig. B.9
NLTE sodium abundance in HD 140283 from Na i 5889.95 Å (D2) (upper panel) and Na i 8194.82 Å (lower panel) lines. Symbols are the same as in Fig. B.2. |
| Open with DEXTER | |
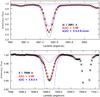 |
Fig. B.10
LTE aluminum abundance in HD 140283 from Al i 3961.52 Å line (upper panel) and potassium abundance from K i 7698.96 Å line (lower panel). Symbols are the same as in Fig. 3. |
| Open with DEXTER | |
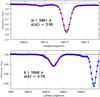 |
Fig. B.11
NLTE aluminum abundance in HD 140283 from Al i 3961.52 Å (upper panel) and NLTE potassium abundance from the K i 7698.96 Å line (lower panel) lines. Symbols are the same as in Fig. B.2. |
| Open with DEXTER | |
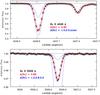 |
Fig. B.12
LTE scandium abundances in HD 140283 from Sc ii 4246.82 Å (upper panel) and Sc ii 5526.79 Å (lower panel) lines. Symbols are the same as in Fig. 3. |
| Open with DEXTER | |
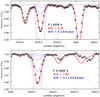 |
Fig. B.13
LTE vanadium abundances in HD 140283 from V i 4379 Å (upper panel) and V ii 4023 Å (lower panel) lines. Symbols are the same as in Fig. 3. |
| Open with DEXTER | |
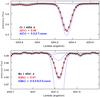 |
Fig. B.14
LTE chromium abundance in HD 140283 from Cr i 4254.33 Å line (upper panel) and manganese abundance from Mn i 4041.35 Å line (lower panel). Symbols are the same as in Fig. 3. |
| Open with DEXTER | |
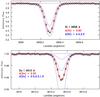 |
Fig. B.15
LTE nickel abundance in HD 140283 from Ni i 3858.29 Å line (upper panel) and zinc abundance from Zn i 4810.53 Å line (lower panel). Symbols are the same as in Fig. 3. |
| Open with DEXTER | |
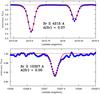 |
Fig. B.16
NLTE strontium abundance in HD 140283 from Sr ii 4215.52 Å (upper panel) and Sr ii 10327.31 Å (lower panel) lines. Symbols are the same as in Fig. B.2. |
| Open with DEXTER | |
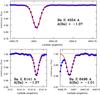 |
Fig. B.17
NLTE barium abundance in HD 140283 from Ba ii 4554.03 Å (upper panel), Ba ii 6141.70 Å (lower left panel), and Ba ii 6496.92 Å (lower right panel) lines. Symbols are the same as in Fig. B.2. |
| Open with DEXTER | |
© ESO, 2015
Current usage metrics show cumulative count of Article Views (full-text article views including HTML views, PDF and ePub downloads, according to the available data) and Abstracts Views on Vision4Press platform.
Data correspond to usage on the plateform after 2015. The current usage metrics is available 48-96 hours after online publication and is updated daily on week days.
Initial download of the metrics may take a while.