| Issue |
A&A
Volume 583, November 2015
|
|
|---|---|---|
| Article Number | A60 | |
| Number of page(s) | 23 | |
| Section | Extragalactic astronomy | |
| DOI | https://doi.org/10.1051/0004-6361/201526752 | |
| Published online | 28 October 2015 | |
Online material
Appendix A: Analysis using a base of integrated cluster spectra (Bica method)
Base elements in the age × metallicity plane for the Bica (1988) analysis. E(B−V)i = 0.0.
Results for the Bica (1988) analysis.
To historically link previous methods to study the stellar content in galaxies with modern SED and full spectrum fitting techniques, we analyse the data via a spectral population synthesis technique originally developed by Bica (1988), and later updated by Schmitt et al. (1996). This method aims at reproducing the observed equivalent widths (Ws) and the continuum ratios (Cs) using the integrated-light spectra of an ensemble of star clusters with different ages and metallicities (e.g. Bica & Alloin 1986a,b, 1987; Bica et al. 1988, 1994). The W and C values from the cluster base are built in a grid parametrized by the age and the metallicity, and extrapolated in the case of high metallicities unreachable through observations. In the current analysis, we have used eight components to map the age-metallicity plane, with the constraint that their metallicities be solar and subsolar. Indeed, in a low mass galaxy such as the LMC, we do not expect to find stellar components with metallicity above solar (Pagel & Tautvaisiene 1998). The base elements used in the analysis are listed in Table A.1. The results are shown in Fig. A.1.
From the population analysis above it is clear that the 1 Gyr and 100 Myr components are very important in flux (see Fig. A.1, top panel). It is also important to compute how much they represent in terms of mass fractions. For such purposes we employed a flux-mass transformation method (Bica et al. 1988). This method uses different ratios of mass to V-light (M/LV) related to each age component. It also takes into account metallicity effects among old star clusters. We show in Fig. A.1 (bottom panel) the mass distributions for each component. We can see that the 1 Gyr and 100 Myr components are less than 10% and 5% in mass, respectively.
We can interpret those results as star formation along three different age ranges (less than 0.5 Gyr, 0.5–5 Gyr, and 5–14 Gyr;
see Table A.2). If we consider that the mass at every age range was formed uniformly and we compute a “pseudo-SFR” dividing the mass alive percentage by the age width for each population, which leads us to recent star formation of 4.4 Gyr-1, followed by a drop (2.2 Gyr-1) with a higher “pseudo-SFR” at older ages. These results differ from the STECKMAP and CMD results, essentially because of a lack of time resolution at old ages (see Table 3).
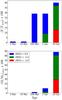 |
Fig. A.1
Synthesis results using the Bica analysis. Top panel, flux fraction of the different base elements. Bottom panel, mass alive fraction of the different base elements. |
| Open with DEXTER | |
Appendix B: Recovered star formation histories for the STECKMAP tests
We include in this appendix the recovered SFH in the tests described in Sect. 3.2.3. We show the stellar content for the 24 tests in a similar way as in Fig. 4. As already outlined in the main body of the paper, we note the consistency between different tests except in some extreme cases.
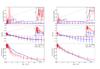 |
Fig. B.1
Comparison between the LMC bar SFH from the CMD and the integrated spectrum using STECKMAP. Left: test 1; right: test 2. For further information see Fig. 4. |
| Open with DEXTER | |
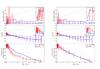 |
Fig. B.2
Comparison between the LMC bar SFH from the CMD and the integrated spectrum using STECKMAP. Left: test 3; right: test 4. For further information see Fig. 4. |
| Open with DEXTER | |
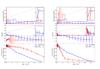 |
Fig. B.3
Comparison between the LMC bar SFH from the CMD and the integrated spectrum using STECKMAP. Left: test 5; right: test 6. For further information see Fig. 4. |
| Open with DEXTER | |
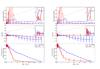 |
Fig. B.4
Comparison between the LMC bar SFH from the CMD and the integrated spectrum using STECKMAP. Left: test 7; right: test 8. For further information see Fig. 4. |
| Open with DEXTER | |
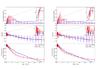 |
Fig. B.5
Comparison between the LMC bar SFH from the CMD and the integrated spectrum using STECKMAP. Left: test 9; right: test 10. For further information see Fig. 4. |
| Open with DEXTER | |
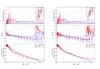 |
Fig. B.6
Comparison between the LMC bar SFH from the CMD and the integrated spectrum using STECKMAP. Left: test 11; right: test 12. For further information see Fig. 4. |
| Open with DEXTER | |
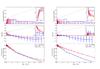 |
Fig. B.7
Comparison between the LMC bar SFH from the CMD and the integrated spectrum using STECKMAP. Left: test 13; right: test 14. For further information see Fig. 4. |
| Open with DEXTER | |
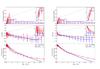 |
Fig. B.8
Comparison between the LMC bar SFH from the CMD and the integrated spectrum using STECKMAP. Left: test 15; right: test 16. For further information see Fig. 4. |
| Open with DEXTER | |
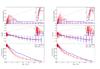 |
Fig. B.9
Comparison between the LMC bar SFH from the CMD and the integrated spectrum using STECKMAP. Left: test 17; right: test 18. For further information see Fig. 4. |
| Open with DEXTER | |
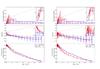 |
Fig. B.10
Comparison between the LMC bar SFH from the CMD and the integrated spectrum using STECKMAP. Left: test 19; right: test 20. For further information see Fig. 4. |
| Open with DEXTER | |
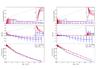 |
Fig. B.11
Comparison between the LMC bar SFH from the CMD and the integrated spectrum using STECKMAP. Left: test 21; right: test 22. For further information see Fig. 4. |
| Open with DEXTER | |
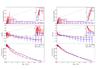 |
Fig. B.12
Comparison between the LMC bar SFH from the CMD and the integrated spectrum using STECKMAP. Left: test 23; right: test 24. For further information see Fig. 4. |
| Open with DEXTER | |
© ESO, 2015
Current usage metrics show cumulative count of Article Views (full-text article views including HTML views, PDF and ePub downloads, according to the available data) and Abstracts Views on Vision4Press platform.
Data correspond to usage on the plateform after 2015. The current usage metrics is available 48-96 hours after online publication and is updated daily on week days.
Initial download of the metrics may take a while.