| Issue |
A&A
Volume 582, October 2015
|
|
|---|---|---|
| Article Number | A79 | |
| Number of page(s) | 14 | |
| Section | Cosmology (including clusters of galaxies) | |
| DOI | https://doi.org/10.1051/0004-6361/201526793 | |
| Published online | 12 October 2015 | |
Online material
Appendix A: MCMC likelihood
In this appendix, we present the results of our MCMC runs for all the scenarios considered in Sect. 4.2, through “triangle” plots showing the 1D and 2D posterior distributions for the calibration parameter ATM, scaling index βTM, the matter density Ωm, and the amplitude of the linear power spectrum σ8. Figure A.1 illustrates the differences between the various mass functions used throughout our work, while Fig. A.2 shows the impact of having the scaling index βTM as a additional free parameter. Figure A.1 presents the impact of the latest Planck 2015 data on our results obtained with the 2013 data.
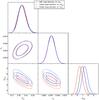 |
Fig. A.1
1D posterior distributions and 2D confidence (68% and 95%) contours for the parameters ATM, Ωm, and σ8, as derived from our MCMC analysis in three different cases: contraints from CMB+clusters using either the SMT mass function (red), the Tinker mass function with a virial mass definition (blue) or with M500 critical masses (black). The statistical analysis of the corresponding MCMC chains is given in Table 2. |
| Open with DEXTER | |
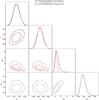 |
Fig. A.2
1D posterior distributions and 2D confidence (68% and 95%) contours for the parameters ATM, βTM, Ωm, and σ8, as derived from our MCMC analysis in two different cases: contraints from CMB+clusters using the Tinker mass function with M500 critical masses, with a fixed scaling index βTM = 2 / 3 (red) or with βTM as a free parameter (black). The statistical analysis of the corresponding MCMC chains is given in Table 2. |
| Open with DEXTER | |
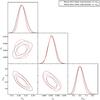 |
Fig. A.3
1D posterior distributions and 2D confidence (68% and 95%) contours for the parameters ATM, Ωm, and σ8, as derived from our MCMC analysis using the Tinker mass function with M500 critical masses, with the Planck 2013 (black) and Planck 2015 (red) data sets. The 68% confidence limits of the scaling law calibration ATM are [6.04,6.80] when using the 2015 CMB data (to be compared to the slightly wider interval [5.97,6.93] with the 2013 data). |
| Open with DEXTER | |
© ESO, 2015
Current usage metrics show cumulative count of Article Views (full-text article views including HTML views, PDF and ePub downloads, according to the available data) and Abstracts Views on Vision4Press platform.
Data correspond to usage on the plateform after 2015. The current usage metrics is available 48-96 hours after online publication and is updated daily on week days.
Initial download of the metrics may take a while.