| Issue |
A&A
Volume 582, October 2015
|
|
|---|---|---|
| Article Number | A1 | |
| Number of page(s) | 33 | |
| Section | Interstellar and circumstellar matter | |
| DOI | https://doi.org/10.1051/0004-6361/201423835 | |
| Published online | 25 September 2015 | |
Online material
Appendix A: More about G010.32−00.15
Appendix A.1: Distance of G010.32−00.15
The distance of this region is very uncertain, and different indicators (and authors) give distances covering the range 2 kpc to 19 kpc.
-
Radio recombination lines give the velocity of the ionized gas:VLSR(H109α) = 9.7 km s-1 (Reifenstein et al. 1970), V(H110α) = 12.0 km s-1 (Downes et al. 1980), V(H110α) = 9.4 km s-1 in the central region (Araya et al. 2007). The molecular condensations present at the waist of the nebula have similar velocities in the range 11.3−13.5 km s-1 (NH3 emission lines; Wienen et al. 2012; see Table 4); see also the CO maps in Beuther et al. (2011; their Figs. 7 and 8). These velocities lead to a kinematic near distance of ~2 kpc or a far distance ~15 kpc.
-
H2CO absorption lines at 6 cm are often used to resolve the distance ambiguity. For distances within the Sun’s orbit, the radial velocity increases with distance from the Sun in the first quadrant, reaches a maximum at the tangent point and then decreases to zero at the Galactocentric radius of the Sun. If the thermal continuum of the H ii region is absorbed by the H2CO molecules, the H2CO-absorbing cloud must be in front of the H ii region. H2CO absorption lines in the direction of G10.31−0.15 are observed at velocities of 11.1 km s-1, 22.3 km s-1, and 38.4 km s-1, with faint components at 3.9 km s-1, 22.3 km s-1, and 47.3 km s-1 (Sewilo et al. 2004; HPBW 2.56′). Similar velocities were measured for the H2CO absorption lines by Wilson (1974) and by Downes et al. (1980). That absorption lines are observed at velocities higher than for the H ii region points to the far kinematic distance. A far distance was adopted by Georgelin & Georgelin (1976; 18.7 kpc), Sewilo et al. (2004; 15.0 kpc), and Du et al. (2011; 15.12 kpc).
-
The velocity at the tangent point is ~150 km s-1, as indicated by the H i emission observed in this direction (Kalberla et al. 1982), but the H2CO lines show no absorption near 150 km s-1 (Sewilo et al. 2004). If G010.32−00.15 was at the far distance, we should observe absorption up to the maximum velocity in this direction. The H2CO absorption only extends up to 47 km s-1, which could be due to a lack of H2CO material near the tangent point. But the same situation is observed with the atomic hydrogen: the H i absorption extends only to 45 km s-1 in the direction of G010.3−00.1 (and of the two nearby H ii regions G010.2−00.3 and G010.6−00.4), whereas its emission extends to 152 km s-1 (Kalberla et al. 1982). Thus the H ii region G010.32−00.15 cannot be at the far distance. This situation has been discussed by Wilson (1974) and Downes et al. (1980). They adopt a distance of ~5–6 kpc, corresponding to the highest H2CO absorption velocity. A distance of 6 kpc also has been adopted by Beuther et al. (2011) in their study of W31.
-
The nearby region G010.2−00.3 has velocities similar to our region, both for the ionized gas and for the associated molecular material (Wilson 1974; Downes et al. 1980; Araya et al. 2007; Beuther et al. 2011; Wienen et al. 2012), so these two regions probably lie nearby. Near-IR photometry and K-band spectroscopy of the exciting stars of G010.2−00.3 by Blum et al. (2001) indicate a distance of 3.4 ± 0.3 kpc.
We identified the exciting cluster of the H ii region in Sect. 6.1 and its main O5V–O6V exciting star. The spectrophotometric distance of this star is estimated to be 1.75 kpc, in good agreement with the near kinematic distance. And we have shown that this distance could not be greater than 2.5 kpc.
How can we reconcile this maximum distance of 2.5 kpc for G010.32−00.15 with the H2CO and H i absorption spectra? We note that this situation is not unique to G010.32−00.15. A parallax of a maser spot associated with G010.6−00.4 was measured by Sanna et al. (2014), and they find a distance of 4.95![]() pc. Quireza et al. (2006) find a radio recombination line velocity of −1.1 km s-1 for G010.6−00.4, which leads to a kinematic distance of ~18 kpc (and no near kinematic distance). Similarly, the H ii region G009.62+00.19 has a parallax distance of 5.15
pc. Quireza et al. (2006) find a radio recombination line velocity of −1.1 km s-1 for G010.6−00.4, which leads to a kinematic distance of ~18 kpc (and no near kinematic distance). Similarly, the H ii region G009.62+00.19 has a parallax distance of 5.15![]() pc (Sanna et al. 2009) and near and far kinematic distances of ~1 and ~16 kpc. Hofner et al. (1994) found H i absorption up to 55 km s-1 for G009.62+00.19. All three sources are near a Galactic longitude of 10°, have LSR velocities ≤10 km s-1, have H2CO and H i absorption up to ~50 km s-1, and have large discrepancies between their distances estimated using different indicators. The H2CO and H i clouds that are seen in absorption up to ~50 km s-1 must lie in front of the three sources. This implies that the velocity field cannot be described by approximately circular orbits about the Galactic centre. The deviations from circular velocity here have been noticed by many previous authors and are probably the effects of the Galactic bar(s) (e.g., Rodriguez-Fernandez & Combes 2008). Clearly, kinematic distances in this part of the Galaxy are not accurate.
pc (Sanna et al. 2009) and near and far kinematic distances of ~1 and ~16 kpc. Hofner et al. (1994) found H i absorption up to 55 km s-1 for G009.62+00.19. All three sources are near a Galactic longitude of 10°, have LSR velocities ≤10 km s-1, have H2CO and H i absorption up to ~50 km s-1, and have large discrepancies between their distances estimated using different indicators. The H2CO and H i clouds that are seen in absorption up to ~50 km s-1 must lie in front of the three sources. This implies that the velocity field cannot be described by approximately circular orbits about the Galactic centre. The deviations from circular velocity here have been noticed by many previous authors and are probably the effects of the Galactic bar(s) (e.g., Rodriguez-Fernandez & Combes 2008). Clearly, kinematic distances in this part of the Galaxy are not accurate.
Appendix A.2: Other candidate Class I YSOs in the vicinity of G010.32−00.15
We discuss here the candidate Class I YSOs present in the vicinity of G010.32−00.15, which are not associated with it or whose association with the central H ii region is uncertain.
-
YSOs in the direction of C7: this clump does not belong to the complex; its distance is unknown, preventing us from estimating its mass and density. The northern extension of C7 contains a small H ii region detected on the MAGPIS radio map and the faint candidate Class I YSO #14 (Fig. A.1a). YSO #14 has no detectable 24 μm and 70 μm counterparts, and its nature is uncertain (a low-luminosity Class II or flat-spectrum source). The flux of the UC H ii region is given in Table A.2; its exciting star has not been identified. Its size is
 (beam deconvolved). The 70 μm source associated with this UC H ii region has a flux of 130 ± 10 Jy. C7 contains a compact H ii region (see Table A.2) and the candidate Class I YSO #15 in a nearby direction. YSO #15 is bright at 24 μm ([8.0]−[24] in the range 4.30 mag to 4.47 mag) and at 70 μm, but at this last wavelength it is difficult to separate it from the extended emission linked to the compact H ii region. At 70 μm we measured a flux of 113 ± 30 Jy for this H ii region plus YSO #15. A class II methanol maser was detected by Green et al. (2010) at less than 1″ from YSO #15. The velocity of the maser, 39.0 km s-1, indicates that it is associated with C7 and not with the G010.32−00.15 bipolar nebula. Thus YSO #15 is clearly a Class I YSO embedded in C7. A small Spitzer and Herschel-PACS diffuse region lies about 25″ west of YSO #15, source F in Fig. A.1. It has no detectable radio-continuum counterpart on the MAGPIS map (flux at 20 cm ≤ 5 mJy).
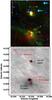
Fig. A.1 C7 clump. a) Colour composite image with the 24 μm, the 8.0 μm, and the 3.6 μm emissions, respectively in red, green, and blue (linear units). Two candidate Class I YSOs, #14 and #15, are identified; the brightness of YSO #14 has been enhanced. The three blue arrows point to candidate AGB stars. The red contours are for the column density (same levels as in Fig. 21b). b) The column density contours are superimposed on the MAGPIS radio map at 20-cm. The UC and compact H ii regions are identified, which have 24 μm and 70 μm counterparts.
Open with DEXTER -
Sources at the periphery of the bipolar nebula: they are identified in Fig. A.2. YSOs #16 and #17 lie at the extremity of the bottom lobe. YSO #16 presents a 24 μm and a faint 70 μm counterpart ([8]−[24] = 3.15 mag, hence an uncertain nature, Class II or flat-spectrum YSO). YSO #17 has no detectable 24 μm and 70 μm counterparts so it is probably a low-luminosity Class II YSO. They are not associated with a condensation (the column density in their direction is ~2.5 × 1022 cm-2). YSOs #18 and #19 lie east of the southern lobe in a region where the column density is in the range 3 to 4 × 1022 cm-2). They have a 24 μm counterpart but no detectable 70 μm one ([8]−[24] is in the range 2.53 mag to 2.83 mag for YSO #18 and ~3.01 mag for YSO #19). They are probably low-luminosity Class II YSOs. YSOs #24 and #25 lie in the direction of the northern lobe, in directions of intermediate column density (in the range 4 to 5 × 1022 cm-2). They have 24 μm counterparts and colours typical of Class I YSOs ([8]−[24] = 4.35 mag for #24 and 3.97 mag for #25). YSO #24 has a faint 70 μm counterpart, and YSO #25 has none. YSO #27 lies in the direction of a nearby faint H ii region. We argue that it is probably associated with this H ii region and not with the bipolar nebula. (There is no velocity measurement to indicate the distance of this nearby nebula.) The association is uncertain for YSO #26, which lies in the direction of a filament west of the bipolar nebula (column density 4.8 × 1022 cm-2). The colour of these sources indicates that they are probably flat-spectrum YSOs ([8]−[24] ~ 3.35 mag for both).
 |
Fig. A.2
Identification of the candidates Class I YSOs in the vicinity of G010.32−00.15. The underlying grey image is the Spitzer 8.0 μm image. The red contours are the column density contours (levels of 3, 5, 10, and 15 × 1022 cm-2. The intensity of some YSOs has been enhanced.) |
| Open with DEXTER | |
Appendix A.3: Tables
Exciting cluster of G010.32−00.15. Data extracted from the UKIDSS catalogue except for star #1.
Ultracompact H ii regions near G010.32−00.15.
Appendix B: Apertures used to estimate the mass of the clumps
|
Fig. B.1
C1, C2, and C3 clumps in the field of G319.88+00.79. The underlying grey image is the column density map. The apertures used to integrate the column density and estimate the masses are indicated (red contours; these apertures follow the level at half peak-values, after correction for a background emission). The green contours correspond to column densities of 1, 2, 4, and 6 × 1022 cm-2 (as in Fig. 7d). |
|
| Open with DEXTER | |
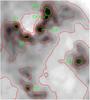 |
Fig. B.2
C1 to C7 clumps in the field of G010.32-00.14. The underlying grey image is the column density map (logarithmic units). The apertures used to integrate the column density and estimate the masses are indicated (green contours; the polygonial apertures follow the level at half peak-values, after correction for the background emission, the same for all clumps). The red contours correspond to column densities of 0.3, 0.5, 0.75, 1.0, and 1.5 × 1023 cm-2 (as in Fig. 15d). |
| Open with DEXTER | |
Appendix C: Infrared dark clouds in the direction of the bipolar HII regions
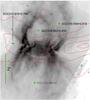 |
Fig. C.1
IRDCs detected by Peretto & Fuller (2009) in the vicinity of G319.88+00.79. The underlying grey image is the Spitzer 8.0 μm image. The red contours correspond to column densities of 1, 2, 4, and 6 × 1022 cm-2. |
| Open with DEXTER | |
 |
Fig. C.2
IRDCs detected by Peretto & Fuller (2009) in the vicinity of G010.32−00.15. The underlying grey image is the Spitzer 8.0 μm image. The red contours correspond to column densities of 0.5, 1.0, 1.5, and 2.0 × 1023 cm-2. |
| Open with DEXTER | |
© ESO, 2015
Current usage metrics show cumulative count of Article Views (full-text article views including HTML views, PDF and ePub downloads, according to the available data) and Abstracts Views on Vision4Press platform.
Data correspond to usage on the plateform after 2015. The current usage metrics is available 48-96 hours after online publication and is updated daily on week days.
Initial download of the metrics may take a while.