| Issue |
A&A
Volume 580, August 2015
|
|
|---|---|---|
| Article Number | A41 | |
| Number of page(s) | 13 | |
| Section | The Sun | |
| DOI | https://doi.org/10.1051/0004-6361/201425115 | |
| Published online | 24 July 2015 | |
Online material
Appendix A: Additional figures
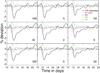 |
Fig. A.1
FD event of 11 April 2001 and magnetic field for nine directions in GRAPES-3 muon telescope. The linestyles are the same as used in Fig. 2. |
| Open with DEXTER | |
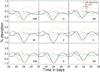 |
Fig. A.2
FD event of 23 May 2002 and magnetic field for nine directions in GRAPES-3 muon telescope. The linestyles are the same as used in Fig. 2. |
| Open with DEXTER | |
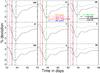 |
Fig. A.3
FD event on 11 April 2001. The linestyles are the same as used in Fig. 5. |
| Open with DEXTER | |
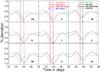 |
Fig. A.4
FD event on 23 May 2002. The linestyles are the same as used in Fig. 5. |
| Open with DEXTER | |
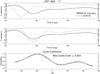 |
Fig. A.5
Cross correlation of the cosmic ray flux with Btotal. The top panel shows the percentage deviation of cosmic ray flux using solid black lines and the magnetic field using dotted black lines (scaled to fit in the frame). The middle panel shows the same with magnetic field shifted to the right corresponding to the time lag and the bottom panel shows the correlation coefficient for different lags. |
| Open with DEXTER | |
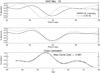 |
Fig. A.6
Cross correlation of the cosmic ray flux with Btotal. The top panel shows the percentage deviation of cosmic ray flux using solid black lines and the magnetic field using dotted black lines (scaled to fit in the frame). The middle panel shows the same with magnetic field shifted to the right corresponding to the time lag and the bottom panel shows the correlation coefficient for different lags. |
| Open with DEXTER | |
Appendix B: Additional Tables
FD events for which the correlation coefficient between the profiles of the FD and the IMF enhancement ≥70%.
© ESO, 2015
Current usage metrics show cumulative count of Article Views (full-text article views including HTML views, PDF and ePub downloads, according to the available data) and Abstracts Views on Vision4Press platform.
Data correspond to usage on the plateform after 2015. The current usage metrics is available 48-96 hours after online publication and is updated daily on week days.
Initial download of the metrics may take a while.