| Issue |
A&A
Volume 579, July 2015
|
|
|---|---|---|
| Article Number | A114 | |
| Number of page(s) | 14 | |
| Section | Interstellar and circumstellar matter | |
| DOI | https://doi.org/10.1051/0004-6361/201425118 | |
| Published online | 10 July 2015 | |
Online material
Appendix A: Modeling results: additional figures
Here we present additional figures illustrating details discussed in Sects. 4.2 and 4.3. Figures A.1 and A.2 show the effect of CO abundance XCO in the drop on the DCO+ peak for Test 1 and 4, respectively. Figure A.3 highlights the effect of the upper and lower o/p limits on the DCO+ abundance for
the best approximation models to the DCO+ observations. The effect of the factor used to decrease the temperature profile on the peak position of the modeled DCO+ is explored in Fig. A.4. Figures A.5 and A.6 give a sampling of the observations compared with the radiative transfer modeling of the chemical network results for the different tests, CO abundance profiles and cases.
|
Fig. A.1
Chemical network results for Drop CO abundance with the Test 1 source profile from Jørgensen et al. (2002) for four cases (Table 2). Case d is the same as in the top row center panel of Fig. 6. |
|
| Open with DEXTER | |
|
Fig. A.2
Chemical network results for Drop CO abundance with the decreased-temperature (Test 4) source profile for four cases (Table 2). Case d is the same as in the bottom row center panel of Fig. 6. |
|
| Open with DEXTER | |
|
Fig. A.3
Chemical network results for Drop CO abundance with the decreased-temperature source profile (Test 4) for case d with upper-limit (left), thermal (center) and lower-limit (right) o/p ratio. |
|
| Open with DEXTER | |
|
Fig. A.4
DCO+ Cycle 0 observations compared with the radial profile of the constant and drop CO abundance models, showing the effect of the factor used to decrease the temperature, for case d. A factor of 1.5 with drop CO abundance provides the best approximation to the observed radial profile. |
|
| Open with DEXTER | |
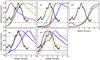 |
Fig. A.5
Comparison of the observations and radiative transfer modeling of the chemical network results. The black line shows the DCO+ observations integrated over the southern clump, with the gray solid and dashed lines showing the 1σ and 4σ levels, respectively. Models are referred to by test, abundance profile (Constant “C” or Drop “D”) and case. Color lines show tests 1 (blue), 2 (green), 3 (orange) and 4 (purple) for the top left panel, and cases a (blue), b (green), d (orange) and f (purple) for the other four panels. |
| Open with DEXTER | |
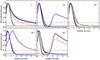 |
Fig. A.6
As in Fig. A.5 but for C18O. Gray solid and dashed lines show the 1σ and 3σ levels respectively. Note that constant CO abundance over-predicts the amount of C18O emission. |
| Open with DEXTER | |
© ESO, 2015
Current usage metrics show cumulative count of Article Views (full-text article views including HTML views, PDF and ePub downloads, according to the available data) and Abstracts Views on Vision4Press platform.
Data correspond to usage on the plateform after 2015. The current usage metrics is available 48-96 hours after online publication and is updated daily on week days.
Initial download of the metrics may take a while.