Free Access
Fig. A.4
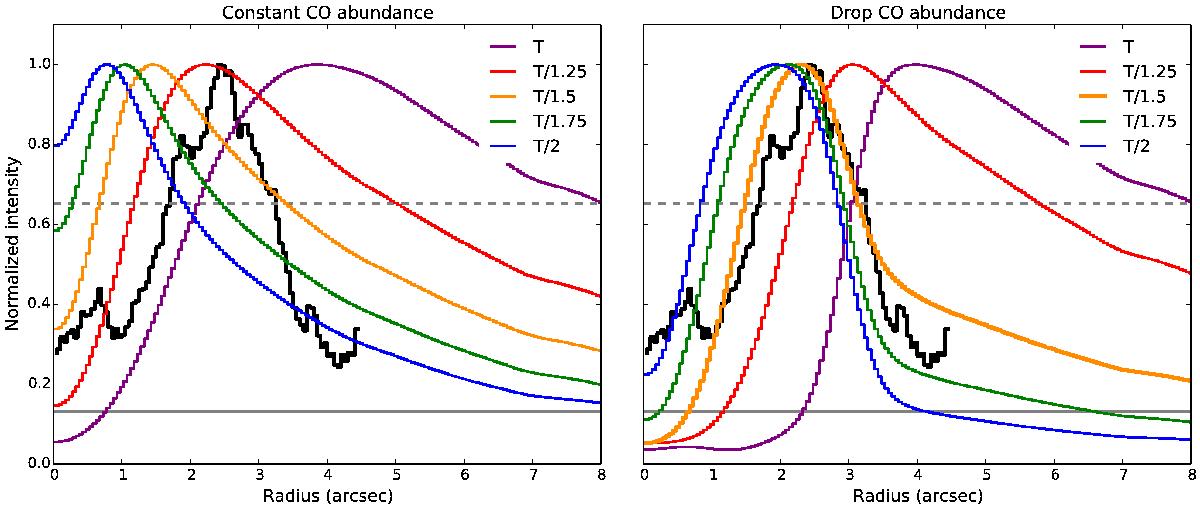
DCO+ Cycle 0 observations compared with the radial profile of the constant and drop CO abundance models, showing the effect of the factor used to decrease the temperature, for case d. A factor of 1.5 with drop CO abundance provides the best approximation to the observed radial profile.
Current usage metrics show cumulative count of Article Views (full-text article views including HTML views, PDF and ePub downloads, according to the available data) and Abstracts Views on Vision4Press platform.
Data correspond to usage on the plateform after 2015. The current usage metrics is available 48-96 hours after online publication and is updated daily on week days.
Initial download of the metrics may take a while.