| Issue |
A&A
Volume 578, June 2015
|
|
|---|---|---|
| Article Number | A20 | |
| Number of page(s) | 7 | |
| Section | Interstellar and circumstellar matter | |
| DOI | https://doi.org/10.1051/0004-6361/201526021 | |
| Published online | 27 May 2015 | |
Online material
Appendix A: Supplementary material
Table A.1 shows the observing log of PACS observations including observations identification numbers (OBSID), observation day (OD), date of observation, total integration time, and pointed coordinates (RA, Dec). Table A.2 shows molecular data and observed lines fluxes and upper limits for all sources that are analyzed in the paper. Figure A.1 shows selected spectral regions to illustrate the quality of the data. Figure A.2 illustrates the patterns of continuum emission at 145 μm and the CO 18–17 line emission at 144 μm toward all the sources.
Log of PACS observations.
Molecular dataa and observed line fluxes.
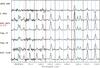 |
Fig. A.1
Spectral scans covering selected H2O, CO, and OH lines in the intermediate-mass protostars from the WISH program. The rest wavelength of each line is indicated by dashed lines: blue for H2O, red for CO, and light blue for OH. |
| Open with DEXTER | |
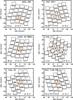 |
Fig. A.2
PACS spectral maps in the CO 18-17 line at 144 μm and the continuum emission at 145 μm in orange contours corresponding to 30%, 50%, 70%, and 90% of the peak value written in the bottom left corner of each map. Wavelengths in microns are translated to the velocity scale on the X-axis using laboratory wavelengths (see Table A.2) of the species and cover the range from –600 to 600 km s-1. The Y-axis shows fluxes in Jy normalized to the spaxel with the brightest line on the map in a range from –0.2 to 1.2. |
| Open with DEXTER | |
© ESO, 2015
Current usage metrics show cumulative count of Article Views (full-text article views including HTML views, PDF and ePub downloads, according to the available data) and Abstracts Views on Vision4Press platform.
Data correspond to usage on the plateform after 2015. The current usage metrics is available 48-96 hours after online publication and is updated daily on week days.
Initial download of the metrics may take a while.