| Issue |
A&A
Volume 577, May 2015
|
|
|---|---|---|
| Article Number | A83 | |
| Number of page(s) | 18 | |
| Section | Planets and planetary systems | |
| DOI | https://doi.org/10.1051/0004-6361/201424915 | |
| Published online | 07 May 2015 | |
Online material
Appendix A: Prior of mantle Si-content
The prior bounds on Si⊚ depend on the prior bounds of Fe/Si⊚ and Mg/Si⊚, since the mass fractions of all oxides in the NCFMAS chemical system must sum to one. The mass fraction of Si can be expressed as 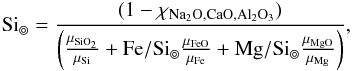 where μ are respective molar weights and the mass fraction of minor oxides are combined in χNa2O,CaO,Al2O3. Transforming from a uniform prior in Fe/Si⊚ and Mg/Si⊚ to the variable Si⊚ we find the prior of Si⊚ being
 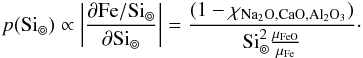 This implies a non-uniform prior for Si⊚. Outside the given interval in Table 1 the prior distribution of Si⊚ is essentially zero.
Appendix B: Temperature profile
We assume a fixed mantle temperature profile that is based on the Earth model. A variable temperature profile for the mantle only introduces negligible variations in the density profile (< 1%). This is demonstrated in Fig. B.1. Surface temperature is fixed at 1000 K and although temperature varies between 2100 K to 3500 K at the core mantle boundary, resultant changes in density are relatively small (Fig. B.1).
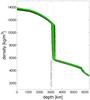 |
Fig. B.1
Sampled profiles of density profiles for Earth. A variable mantle temperature (gray profiles) only introduces little additional variation in density compared to profiles with fixed mantle temperature (green colors). |
| Open with DEXTER | |
|
Fig. C.1
Sampled 1D marginal posterior distributions for Earth using the FMS system: prior (red), posterior (blue) and independent estimates (green) of model parameters: a) mantle Si-content Si⊚; b) mantle Fe/Si⊚; c) mantle Mg/Si⊚; and d) core radius Rc. Independent estimates are listed in Table 2. |
|
| Open with DEXTER | |
Appendix C: Silicate model chemical system
To illustrate the influence of the chosen model chemical system, we solve the inverse problem for the case of the Earth as in Sect. 3.2, but using the simpler FMS system. Sampled model parameter PDFs are shown in Fig. C.1 and relative to NCFMAS (Fig. 4), we observe that with the FMS system mantle composition and core radius are less well predicted, although posterior model parameter variability is, as expected, smaller (fewer chemical components). In addition, future use of stellar determinations of Ca, Na, and Al abundances support the use of the NCFMAS system.
Appendix D: Shannon entropy measure
The Shannon entropy measure of a discrete variable X of possible states { x1,x2,..,xN }, with N being the number of bins, can be written as 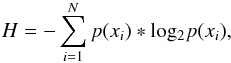 where the xi states represent the distribution histogram bins in which the probability of occurrence is given by
 ![]() The Shannon entropy H has a maximum Hmax = log2(N) when all N states are equally likely (e.g., a uniform distribution) and a minimum Hmin = 0 when all realizations xi fall into a single histogram bin. Clearly, H is bin-size dependent. Here, the bin size used is defined such that the prior range of each model parameter is divided in ≈20 different bins.
The Shannon entropy H has a maximum Hmax = log2(N) when all N states are equally likely (e.g., a uniform distribution) and a minimum Hmin = 0 when all realizations xi fall into a single histogram bin. Clearly, H is bin-size dependent. Here, the bin size used is defined such that the prior range of each model parameter is divided in ≈20 different bins.
© ESO, 2015
Current usage metrics show cumulative count of Article Views (full-text article views including HTML views, PDF and ePub downloads, according to the available data) and Abstracts Views on Vision4Press platform.
Data correspond to usage on the plateform after 2015. The current usage metrics is available 48-96 hours after online publication and is updated daily on week days.
Initial download of the metrics may take a while.