| Issue |
A&A
Volume 575, March 2015
|
|
|---|---|---|
| Article Number | L1 | |
| Number of page(s) | 6 | |
| Section | Letters | |
| DOI | https://doi.org/10.1051/0004-6361/201425304 | |
| Published online | 11 February 2015 | |
Online material
Appendix A: About the solar analog stars
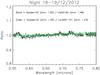 |
Fig. A.1
Spectral ratios of the three solar analog stars observed during the night of 18–19 Dec. 2012. The airmasses at the moment of the acquisition are reported. |
| Open with DEXTER | |
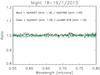 |
Fig. A.2
Spectral ratios of the three solar analog stars observed during the night of 18–19 Jan. 2013. The airmasses at the moment of the acquisition are reported. |
| Open with DEXTER | |
To verify that the observed variability of Ceres’ visible spectra is real, and not an artifact of the different solar analog stars used for calibration, we divided each by all the others to check that this results in a flat spectrum. We considered the LR-R spectra in the same wavelength range used for computing the Ceres’ visible spectral slope, 0.55–0.8 μm. Figures A.1–A.3 show the relative ratios of the three solar analog stars observed during each night, on 18–19/12/2012, 18–19/1/2013, and 19–20/1/2013. For the second of these nights (Fig. A.2), the stars were observed at low airmass and their spectral ratios are flat (slopes of −0.02 ± 0.15%/103 Å and 0.10 ± 0.18%/103 Å). The spectral ratios of stars observed during the other two nights present a slightly positive slope (≲0.5%/103 Å), which is probably due to the higher airmasses involved. The obtained flat behavior makes us confident about the reliability of our results. As for the first of our observing nights (17–18/12/2012), we do not have other solar analogs to compare with the one used to obtain the Ceres’ reflectance; however, Fig. A.4 shows that its division by a solar analog observed the following night still presents a flat spectrum. The same result is found when dividing the spectra of two solar analog stars observed during the two different nights we had in January 2013, as well as when dividing two solar analog stars whose spectra where acquired in December 2012 and January 2013. All of these ratios show some telluric features, which are of course natural because of the different observing conditions (why all of the Ceres’ spectra have been calibrated using a star observed close not only in airmass but also in time) and do not affect the overall spectral slope. The above strongly suggests that the slope variability we present in this work is indeed due to some short-term processes acting over the surface of Ceres.
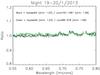 |
Fig. A.3
Spectral ratios of the three solar analog stars observed during the night of 19–20 Jan. 2013. The airmasses at the moment of the acquisition are reported. |
| Open with DEXTER | |
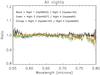 |
Fig. A.4
Spectral ratios of solar analog stars observed during different nights. Night 1 = 17–18 Dec. 2012, Night 2 = 18–19 Dec. 2012, Night 3 = 18–19 Jan. 2013, Night 4 = 19–20 Jan. 2013. |
| Open with DEXTER | |
Appendix B: About a possible link between ours and Herschel’s observations
The likely sources of the water vapor detected by the Herschel Space Observatory are two 60-km wide dark regions centered at long. 123°, lat. +21°, and long. 231°, lat. +23°. In this work we report a temporal spectral variability of Ceres, for nearly equatorial observations centered at planetocentric longitudes ~25° and ~270°, and suggest that this could be associated with variable amounts of exposed water ice. One could object that it is difficult to explain why such longitudes do not coincide, given that ours and Herschel’s observations were made in the same timeframe, and we propose that the spectral changes could be related to outgassing episodes like those seen by Herschel. Moreover, it would be difficult to imagine that the slope changes we measured are provoked by such small active areas. In this regard, we stress that i) our spectra are disk-integrated, so it is basically impossible to state where the water ice could lie exactly on the observed surface. ii) The Herschel telescope detected water vapor, while we suggest the presence of water ice on the surface. Küppers et al. (2014) suggest two dark regions as likely sources of most of the evaporating water, because these are warmer than the average surface, resulting in efficient sublimation of possible water ice reservoirs. The water ice we observe could be more concentrated in other regions of the surface, where dark (hotter) material is less abundant and/or at higher latitudes where sublimation could be slower. iii) The 60-km size estimated in Küppers et al. (2014) is somewhat model-dependent: varying the involved parameters (e.g., the mixing ratio of active/inactive components and its spatial variation over the surface), one can change the size of the “most active” spots. iv) Our observations performed in December 2012 show bluer spectra (i.e., more water ice following our assumption) than in
January 2013. Herschel clearly detected water in October 2012, whereas in March 2013 the emission line was much weaker. As a result, both the datasets could suggest a decreasing quantity of exposed water ice from late 2012 to early 2013.
Appendix C: About the 3-μm band variation
Rivkin & Volquardsen (2010) saw variations of a few percentage points over Ceres’ surface. Since the Rivkin et al. (2006) spectrum is an average over the entire rotational period of Ceres, while the Vernazza et al. (2005) spectrum covers a smaller portion of the surface, it may be that the spectrum did not change at the longitude of the Vernazza observations. While we cannot exclude such a possibility, it would imply that Rivkin et al. (2006) were wrong in excluding the presence of water ice. Here we suggest that water ice is indeed present on the surface of Ceres. Its superficial abundance could be variable and concentrated in particular (colder) regions. We hope that the Dawn mission will clarify this issue, even though it will arrive at Ceres post-perihelion, when the heliocentric distance (around 2.9 AU) will not be favorable for detecting cometary-like activity.
© ESO, 2015
Current usage metrics show cumulative count of Article Views (full-text article views including HTML views, PDF and ePub downloads, according to the available data) and Abstracts Views on Vision4Press platform.
Data correspond to usage on the plateform after 2015. The current usage metrics is available 48-96 hours after online publication and is updated daily on week days.
Initial download of the metrics may take a while.