| Issue |
A&A
Volume 575, March 2015
|
|
|---|---|---|
| Article Number | A129 | |
| Number of page(s) | 11 | |
| Section | Interstellar and circumstellar matter | |
| DOI | https://doi.org/10.1051/0004-6361/201424806 | |
| Published online | 11 March 2015 | |
Online material
Appendix A: CIRs for the case γ = 2
Our results have focused exclusively on the case of γ = 1 for the wind velocity law. Of course, other values of γ may be considered. In general, the solution for the spiral shape of the spiral will not be analytic but must be evaluated numerically. However, analytic solutions for ϕ(ξ) can be found for integer values of γ. Expected values of γ for early-type star winds range from γ = 0.5 from the original Castor et al. (1975) paper for line-driven winds to γ ≈ 0.8 from Pauldrach et al. (1986) that augmented the initial results of Castor et al. to the γ = 1 that is typically used for the inner wind of WR stars (e.g., Schmutz et al., 1989) and then to γ ≈ 3, which has been suggested for some supergiant winds (e.g., Prinja et al., 1995).
As an example, the case of γ = 2 is provided here as a comparison case to γ = 1. In general, higher values of γ tend to increase the radial width over which the bulk of wind acceleration takes place. For example, with ![]() , the radius in the wind where the flow achieves half its terminal speed, w = 0.5, occurs at
, the radius in the wind where the flow achieves half its terminal speed, w = 0.5, occurs at ![]() , which increases as γ becomes larger. As a case in point,
, which increases as γ becomes larger. As a case in point, ![]() for γ = 1, but for γ = 2, the value of
for γ = 1, but for γ = 2, the value of ![]() increases to 3.4b. The net effect of this is that for our construction of the CIR spiral shape, at a given value of ω, a CIR tends to wind up at smaller radius with increasing γ, so the effective winding radius decreases with larger γ.
increases to 3.4b. The net effect of this is that for our construction of the CIR spiral shape, at a given value of ω, a CIR tends to wind up at smaller radius with increasing γ, so the effective winding radius decreases with larger γ.
We need to evaluate ϕ′ for γ = 2. We start with Eq. (25) for a CIR in the equatorial plane, reproduced here:  (A.1)The wind velocity is w = (1 − bξ)2. Inserting w into the above expression gives
  (A.2)The solution for this expression is
  (A.3)Figure A.1 shows a comparison between these functions. There a value of r0/R∗ = 10 is used. At most radii the value of ϕ′ is about 50% to 100% higher for γ = 2 than for γ = 1. As compared to γ = 1, the effective value of r0 is about half as large when γ = 2.
For the polarization one should also note that for a given optical depth of the envelope, larger γ essentially implies a relatively higher density of scatterers at small radii as compared to winds with lower γ values. Figure A.2 compares the polarization light curves for the solutions displayed in Fig. A.1: equatorial CIRs, r0/R∗ = 10, w0 = 0.03, same opening angle, with η = 1, and i0 = 60° for both cases. The polarization is plotted as the ratio p/τ, where τ is the optical depth of the wind. As can be seen, for the selected parameters that are relevant to fast winds, the polarization per unit optical depth is similar for the two cases, but there is a slight phase shift owing to the different degrees of CIR winding. This result does not assume the same base density n0 for the two cases, but rather the same wind optical depth.
(For the same n0, the optical depth of a γ = 2 wind is 1.6 times greater than for γ = 1.)
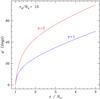 |
Fig. A.1
Comparison of the azimuth location of the CIR centroid with radius from the star. Here blue is for γ = 1, and red is for γ = 2. This example uses a wind radius of r0 = 10R∗. The value of φ′ is generally between 50% to 100% larger for γ = 2 than for γ = 1 indicating that a spiral CIR is considerably more curved at a given radius for the higher γ case. |
| Open with DEXTER | |
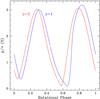 |
Fig. A.2
Comparison of polarization light curves for the γ = 1 and γ = 2 cases shown in the previous figure. The polarization is plotted as normalized to the wind optical depth along a radial. The case of γ = 1 produces a relatively stronger polarization signal (per unit optical depth) than in the case of γ = 2. The polarization extrema are slightly shifted in phase between the two cases. |
| Open with DEXTER | |
© ESO, 2015
Current usage metrics show cumulative count of Article Views (full-text article views including HTML views, PDF and ePub downloads, according to the available data) and Abstracts Views on Vision4Press platform.
Data correspond to usage on the plateform after 2015. The current usage metrics is available 48-96 hours after online publication and is updated daily on week days.
Initial download of the metrics may take a while.