| Issue |
A&A
Volume 574, February 2015
|
|
|---|---|---|
| Article Number | A4 | |
| Number of page(s) | 31 | |
| Section | Extragalactic astronomy | |
| DOI | https://doi.org/10.1051/0004-6361/201424125 | |
| Published online | 15 January 2015 | |
Online material
Appendix A: Notes on the objects
NGC 0034. This is a galaxy pair, but only the south companion has been observed at both frequencies used in our analysis. The centre of radio emission at 1.49 GHz does not coincide with the HST bulge position (Haan et al. 2011), but is ~0.8 arcsec away. The centre of the 8.44 GHz emission is matching the HST bulge position. The maximum flux pixel in the 1.49-GHz map is not at the same RA and Dec and the maximum flux pixel in the 8.44 GHz map. This offset is of the order of ~1 arcsec, which is larger than the pixel size of the 1.49-GHz image (0.4 arcsec). We believe that the shift in the core emission is real and can happen for example when a jet component is blended with the core in a lower resolution observation (Paragi et al. 2000). It has been reported (Lobanov 1998), that this shift is dependent on observing frequency due to a change in synchrotron self-absorption opacity (see Paragi et al. 2000), and the observed brightness peak gets closer to the emission position as we go to higher frequencies. This shift is imprinted in the α-map, where we see a transition of the values of α from flat to steep as we go from SE to NW. Furthermore, there is no indication from the study of Inami et al. (2013) that there is shocked line emission based on IRS spectroscopy of this object. Prouton et al. (2004) estimate a 40% contribution from the AGN to the total infrared luminosity, and based on the optical diagnostics presented in this paper this objects is associated with a Seyfert 2 (Table 4). We classify this object as a radio-AGN because of the shift, and because the radio spectral index in the α-map exceeds out theoretical value of 1.1.
IC 1623A/B. Condon et al. (1991) does not give a measurement for the flux density at 8.44 GHz of this source, but we provide a flux density above 3σ in Table 1 measured from the map. The source is large (24 arcsec long) at 1.49 GHz, but due to the small angular size of the 8.44 GHz map, only a part of the object is observed, hence the α-map is small. The radio spectral index has a wide range of values. The maximum flux pixel in the 1.49 GHz map is not at the same RA and Dec as the maximum flux pixel in the 8.44 GHz map. This offset is of the order of ~1.5 arcsec, which is larger that the pixel size of the 1.49 GHz image (0.4 arcsec). The image absolute coordinate frames are correct within 0.1 arcsec (Jim Condon, priv. comm.). Thus we believe the shift to be real. As a result, the flat radio-spectral-index area is offset from the radio centre at 1.49 GHz, but matches the peak brightness at 8.44 GHz. Rich et al. (2011) find shocked emission and outflow associated with the east galaxy, as a result of the merging process in this late type merging galaxy system. On the contrary, there is no indication from the study of Inami et al. (2013) that there is shocked line emission based on IRS spectroscopy of this object, and the FeII line present in the spectrum, a good indicator of shocked emission, is probably not dominated by shocks. We classify this object as a radio-AGN because of the shift, and because the radio spectral index in the α-map exceeds out theoretical value of 1.1.
CGCG 436-020. The α-map and the α-histogram show a flat range of values (~0.3) in the centre, rapidly steepening outwards. The values of α barely exceed our theoretical cut value to separate AGN from SB of α = 1.1 if we take into account the uncertainties. We thus classify it as AGN/SB in the radio. We note, there is a HST bulge associated with the centre of radio emission (Haan et al. 2011), as additional evidence an AGN could precent.
IRAS F01364-1042. From the α-map of this object we see that the centre of radio emission is associated with a very flat index value, which is slightly steepening outwards. Based on our classification, this steepening might be due to the AGN, but since it does not exceed much, within the uncertainties, our theoretical limit it can also be due to a SB located in an HII region. Then the CR electrons as they escape the SB are losing energy which is shown as steepening in the radio spectral index. We classify this object as AGN/SB.
IRAS F01417+1651. This is a COM radio source with flat range of α values and we classify it as a SB. To be an AGN, the brightness temperature should be above 105 − 106 K (e.g. Clemens et al. 2008; Condon et al. 1991), but this object has a value of ~3 × 10⁴ K. Note: the inverted values of α are located at the edges of the α-maps, and because the errors are of the order of 0.2, we don’t take them into consideration.
UGC 02369 (S). Only the south companion has been observed at 8.44 GHz. From the radio structure at 8.44 GHz we see a core with diffuse radio emission around it. There is no indication for a weak jet from the radio structure. There is no evidence that this is an AGN based on mid-IR AGN diagnostics. Yet, the α-map gives very steep values, above 1.1, suggesting an AGN. Thus we classify this object as radio-AGN.
IRAS F03359+1523. This radio source is associated with the east companion of a galaxy pair, while the HST bulge is associated with the west companion. It has an extended radio source at 1.49 GHz, that presents a core-jet-like feature at 8.44 GHz. The radio spectral index at the centre of the source is flat, steepening outwards with values of α exceeding 1.1, but due to the uncertainties we will classify this as AGN/SB.
ESO 550-IG025 (N). This is the north radio component of the galaxy pair. This object is brighter in the radio than the IR, unlike the south companion where we observe the opposite. This gives a low value of qIR, but not lower than the 1σ uncertainty (see Fig. 3). The north component presents a flat radio-spectral-index distribution steepening outwards. We have to note though that the brightness temperature is low for this object to have a powerful AGN (~103 K; Table 2). Due to the uncertainties in the steep values of α we classify it as AGN/SB.
ESO 550-IG025 (S). This object is associated with the south companion of the galaxy pair, and the α-map exhibits steep values that indicate synchrotron emission (α ~ 0.8), getting higher than values expected from a nuclear SB, i.e. α> 1.1. Thus we classify it as radio-AGN.
IRAS F05189-2524. This object has a [NeV] detection making it a mid-IR AGN. Similarly the 6.2 μm PAH EW suggests an AGN. The optical classification suggests a Seyfert galaxy, probably of type 2. Based on the α-map and the α-histogram, this is a radio-SB, since the α-map gives values of α that are flat. The SB is also suggested by it’s brightness temperature (~2 × 10⁴ K; Table 2). The α-map in this case does not help us identify the AGN in this ULIRG, although it could be a young AGN and we could be seeing emission from a jet that is being formed. Evidence for this could be the slightly elongated towards N-S radio structure at 8.44 GHz, but it can also be an artefact of the radio map.
NGC 2623. The mid-IR diagnostics classify this objects as an AGN. In the optical it is a composite, having both AGN and SB contributions. The α-map shows a flat distribution, steepening outwards with values of α> 1.1, within the uncertainties. Based on our classification this is a radio-AGN.
IRAS F08572+3915. This object shows a compact core at 8.44 GHz with several diffuse point-like structures in the surrounding area. Vega et al. (2008) show that this object contains an AGN that dominates the bolometric luminosity of the galaxy. From the α-map we see that the core emission gives an inverted α, getting flatter outwards. Because values of α at the core of radio emission are inverted, suggesting emission from a face-on jet, we classify this object as a radio-AGN.
UGC 04881 (NE). The north-east radio component of a galaxy pair presents flat values of α that get steeper outwards, as seen by the α-histogram (Fig. 2-right), but values of α barely exceed the value of 1.1, within the uncertainties, thus we classify it as AGN/SB. The mid-IR diagnostics suggest an AGN/SB, and in the optical the BPT diagram gives a composite including both AGN and SB. We see that the α-map and α-hist does not help us distinguish between the AGN and the SB.
UGC 04881 (SW). The α-map of the SW radio component shows steep values of α ~ 0.8, indicating synchrotron emission, that get larger than 1.1. This steepening and spectral ageing suggest an AGN and not a nuclear SB, since the latter have short lifetimes. We note that the brightness temperature is low (~1.5 × 10² K; Table 2). Based on the 6.2 μm EW diagnostic, this is a SB, while based on the BPT diagram it is a composite. We classify it as a radio-AGN.
UGC 05101. The α-map shows a flat distribution in the centre, steepening outwards with values of α> 1.1. Based on our classification this is a radio-AGN. This object is also an AGN based on the mid-IR diagnostics presented in the analysis, and a Seyfert galaxy in the optical.
IRAS F10173+0828. The α values are negative suggesting self-absorption as expected in a face-on AGN with the jet pointing towards the observer. The brightness temperature is ~8 × 10⁴ K (Table 2), close to the value for AGN. We classify it as a radio-AGN.
IRAS F10565+2448. This is a compact radio source at 1.49 GHz, but at 8.44 GHz it appears more structured. Based on the distribution of values of the radio spectral index, and the histogram, this is a radio-SB. The inverted values of α located at the edges of the α-map suggest optically thick region at a distance of 2 arcsec from the centre of the radio source at 1.49 GHz. Having an optically thick region so far from the nucleus is rare, but has been observed before (e.g. Inami et al. 2010). After checking the HST image of this galaxy we do not see any feature or excess emission at the position where the radio spectral index in inverted. We believe this is an area where the obscuration is either too high even for radio observations to penetrate or the inverted values are caused by the very diffuse radio emission at 8.44 GHz at the edges of this radio source. Since the errors are of the order of 0.2, we don’t take these values into consideration.
MCG +07-23-019. This is an extended radio source at 1.49 GHz, and at 8.44 it presents a jet-like structure (similar to FRI; Fanaroff & Riley 1974), whose centre is not associated with the centre of IR emission at 8 μm (map not shown here). The α values are flat in the centre of radio emission at 1.49 GHz, steepening outwards and exceeding the value of 1.1, which is also seen in the histogram. Based on our classification this is a radio-AGN.
UGC 06436 (NW). The north-west companion of this system exhibits flat values of α, steepening outwards, as seen in the α-map and histogram exceeding the value of 1.1, but due to the uncertainties we classify it as AGN/SB. We note the low brightness temperature (~6 × 10² K; Table 2) that does not favour a powerful AGN.
UGC 06436 (SE). The α-map of the south-east radio companion of this galaxy pair has flat values in the centre steepening slightly outwards, not exceeding the value of 1.1. We classify this galaxy as a radio-SB.
NGC 3690 (E). The east radio component of this interacting system has a complex radio structure, and the α-map shows four discrete areas. The central radio component, the one associated with the bulge, has flat values of α in the centre steepening rapidly outwards and getting higher than 1.1 suggesting a radio-AGN. The other areas have the characteristics of SB regions. The wide range of α values in the histogram are due to the fact the radio source is composed of smaller radio components at 8.44 GHz. By adding up these separate α-maps creates a histogram with wide range of values of α. We classify this object as AGN/SB in the sense that it contains both AGN and SB.
NGC 3690 (W). The west radio companion of this galaxy merger also has a complex radio structure, and in the α-map we see three discrete areas. The NE area displays steep values of α getting larger than 1.1 going outwards, suggesting an AGN. The other two regions show a flat centre, steepening outwards slightly, probably from a SB. The wide range of α values in the histogram are due to the fact the radio source is composed of smaller radio components at 8.44 GHz. By adding up these separate α-maps creates a histogram with wide range of values of α. We classify the west radio companion of the galaxy pair as AGN/SB in the sense that it contains both AGN and SB.
IRAS F12112+0305 (NE). This is a double radio source in a galaxy merger, where the NE component is associated with the NE merging galaxy. The distribution of α values goes from inverted to flat, but the spatial distribution is particular in the sense that from SW to NE α gets from inverted to flat values. Also, the centre of the NE radio component has highest values of α than the surroundings. We see that the NE radio component falls mainly in category 2 of histograms. The inverted values of α are located at the edges of the radio source, and due to the uncertainty we do not take them under consideration. We classify it as a radio-SB. For the NE radio component we have a [OIV] measurement, which does not on it’s own confirm the presence of an AGN. In order to obtain measurements for the total infrared luminosity, we found the fractional contribution of the two components at 8 μm and applied this to the LIR of the system. The values are given in Table 1.
IRAS F12112+0305 (SW). The SW radio component of this galaxy pair is associated with the SW merging galaxy, and has a category 2 histogram with some inverted values at the edges of the source. Due to the uncertainty we will classify it as AGN/SB.
UGC 08058. The inverted radio spectral index and the range of variations suggest emission coming from a face-on AGN with the jets pointing towards the observer. We classify it as a radio-AGN.
VV 250a (NW). This is the north-west companion of an interacting galaxy-system. The flat values of α in the centre of this source, steepening outwards are highly uncertain around the value of 1.1. Thus we cannot distinguish between an AGN or a SB. We classify it as AGN/SB.
VV 250a (SE). Taking into account the errors in α and after looking at the histogram for this source, we classify it as category 2 and thus a SB due to the flat values of α.
UGC 08387. The map at 8.44 GHz reveals a jet-like radio structure, FRI-like (Fanaroff & Riley 1974). The centre of radio emission matches the HST bulge position. The α-map shows a distribution of flat values which are steepening outwards, getting higher than 1.1. We classify this as a radio-AGN. Although the 6.2 μm PAH EW suggests this is a SB, we get a [Ne V] detection telling us this object contains an AGN. The question is, how is it possible for an object to have strong 6.2 μm PAH feature that was not destroyed by the AGN. One explanation could be that the PDR is located in a circumnuclear region that does not get influenced by the AGN, thus the PAH feature is not being affected.
NGC 5256 (NE). This is the north-east companion of a galaxy system, a compact radio source. Based on the distribution of values of the radio spectral index and the histogram, and the steepening in the values of alpha at the edges of the source (α< 1.1), we classify this as a radio-SB. Note that in the optical it is classified as LINER (Mazzarella et al. 2012). However, the presence of a compact, luminous hard X-ray source and evidence for a bi-conic ionisation cone in B- and I-band HST images aligned with corresponding radio continuum features provide strong evidence for an AGN-driven outflow from this nucleus (Mazzarella et al. 2012).
NGC 5256 (SW) & (C). At 1.49 GHz the SW and C (for centre) radio components are barely separated. The C radio component at 13:38:17.5 +48:16:36 is not associated with the 8 μm source (map not shown here). The source is in-between the two galaxies of this interacting system, is believed to be a very fast and short-lived shock that effectively destroys most of the dust grains, sublimates the molecular gas, and inhibits star formation (Mazzarella et al. 2012). Based on our radio classification, and the steepening of α (<1.1), we classify it as a AGN/SB, in the sense that is associated with an AGN since it has the signature of a radio-AGN. The SW radio component shows flat distribution of values steepening outwards rapidly and exceeding the value of α = 1.1. Also the radio centre is associated with the bulge. We classify this one as radio-AGN. We have [Ne V] measurement for the SW radio component and [O IV] for the C radio component. The [NeV] emission from this nucleus is also consistent with the AGN classification. The fact that the PAH feature suggests an AGN/SB can be explained by a circumnuclear star-forming region that does not get affected by the AGN.
NGC 5257 (NW). Only the north-west companion of this interacting galaxy-system has been observed at 8.44 GHz. This radio source has a complex radio structure where the radio at 1.49 GHz traces the gas in the spiral arms of the NW galaxy. Only the nucleus was observed at 8.44 GHz due to the smaller field of view of the 8.44 GHz observations compared to the one at 1.49 GHz. In Fig. A.1 we give just the radio source associated with the nucleus for presentation issues. The α-map and histogram show a flat α distribution, and thus we classify it as a radio-SB. We note that there are some steep values at the edges of the central radio source and the explanation is cooling of CR electrons; yet the uncertainty is of the order of 0.2 for these values for α.
UGC 08696. At 8.44 GHz we see a complex system. There is a double radio source associated with the IR source at 8 μm (map not shown here), which has jet-like structure and has two additional features, the brightest of which is located north-east of the radio centre. The α-map shows flattening in the centre, following the 8.44-GHz structure. The values get steeper towards the SE of the centre. Based on the α-map and the histogram this is a radio-AGN, due to the steepening of α> 1.1.
IRAS F14348-1447 (NE). This is the NE radio component of a double radio source, associated with a merging galaxy-system. The radio centre at 1.49 GHz is associated with the HST bulge. The radio sources are not completely separated, so the histograms created are imperfect. We see that the NE component matches category 1 of our classification, with α steepening above 1.1 but due to the uncertainties we classify it as AGN/SB. It is also a mid-IR AGN based on the PAH feature, and a LINER in the optical. In order to obtain measurements for the total infrared luminosity, we found the fractional contribution of the two components at 8 μm and applied this to the LIR of the system. The values are given in Table 1.
IRAS F14348-1447 (SW). This is the SW radio component of a double radio source, associated with a merging galaxy-system. The radio centre of the south component is not matching the one at 8 μm (map not shown here). The radio centre at 1.49 GHz is associated with the HST bulge. The radio sources are not completely separated, so the histograms created are imperfect. The SW radio component matches category 1, with steepening above α = 1.1, but due to the uncertainties we classify it as AGN/SB.
VV 340a (N). Only the north companion of the interacting system has been observed at both 1.49 and 8.44 GHz. The x-shaped radio structure at 1.49 GHz suggests a double-double radio source or an X-shaped radio source (e.g. Capetti et al. 2002), i.e. a restarted radio source associated with an AGN. We do not have further observations at 8.44 GHz to cover the whole area seen at 1.49 GHz. Based on our classification and the steep values of α (>1 going outwards), we classify it as radio-AGN. This object has a [NeV] detection which indicates the presence of an AGN, while the 6.2 μm EW classifies it as a SB. Probably there is a circumnuclear PDR region that does not get affected by the AGN. Based on the BPT this is a SF object.
VV 705 (N). This is the north radio component of an interacting galaxy-system, showing flat α in the centre steepening outwards with α> 1 being highly uncertain. Thus we classify it as a AGN/SB. This object is classified as a SB based on the 6.2 μm EW. The small radio contour between the north and south radio components has a steep distribution of values suggesting synchrotron emission, maybe as a result of the interaction between the galaxies.
VV 705 (S). The south companion of this galaxy system shows values of α associated with synchrotron emission (α ~ 0.8), and steepening of the values outwards exceeding α = 1.1. Based on our classification this is a radio-AGN. This object is classified as a SB based on the 6.2 μm EW.
IRAS F15250+3608. The α-map of this compact radio source shows a negative distribution of values suggesting synchrotron self-absorption. A jet from an AGN pointing towards the observer is a possible explanation. The brightness temperature is of the order of 105 K (Table 2) which makes us confident to classify it as a radio-AGN.
UGC 09913. At 8.44 GHz we see a double radio structure, with diffuse radio emission around it. The centre of radio emission is associated with inverted values of α suggesting synchrotron self-absorption, before emission becomes optically thin. The steepening of the radio spectral index from the centre outwards, as seen in the α-map and histogram, can be either from an AGN or due to CR electrons in an HII region. Thus we classify it as AGN/SB.
NGC 6090. This is a beautiful galaxy merger that displays a complex double radio structure at 1.49 GHz. Only the NE radio component has been observed at 8.44 GHz, and shows diffuse radio emission. The α-map gives a distribution of steep values suggesting a radio-AGN. In the mid-IR it is classified as a SB, and as a Seyfert based on the BPT diagram.
IRAS F17132+5313 (NE). This is the north-east radio components of a galaxy pair that shows a distribution of steep values of α. We believe the NE component is a radio-AGN, due to the intense steepening of the radio spectral index further out from the core, suggesting synchrotron ageing from an AGN. We have [Ne V] and [O IV] measurement only for the NE component. In order to obtain measurements for the total infrared luminosity, we found the fractional contribution of the two components at 8 μm and applied this to the LIR of the system. The values are given in Table 1. Condon et al. (1991) do not give brightness temperature for the NE radio component.
IRAS F17132+5313 (SW). The south-west radio component shows flat values of α suggesting a compact SB. We do not have mid-IR nor optical classification for this object.
IRAS F22491-1808. The HST bulge position agrees with the radio centre at 8.44 GHz but not at 1.49 GHz, but the distance between the radio centres is negligible. The α-map gives a flat distribution of values, steepening outwards, but we cannot distinguish between AGN or SB due to the uncertainties. We classify this is as AGN/SB.
IC 5298. This radio source resembles an FRI radio source (Fanaroff & Riley 1974) at 8.44 GHz, and has a tail at 1.49 GHz. The distribution of α values, flat in the centre steepening outwards (α> 1.1), suggests a radio-AGN. We note that the uncertainties in α, in particular the α − dα value is 1.1, but we will keep the radio-AGN classification because there is also an indication from the radio structure. This object is also classified as an AGN based on the mid-IR diagnostics, and is a Seyfert 2 or LINER in the optical.
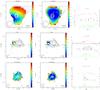 |
Fig. A.1
Each row corresponds to one object or system from our sample. Left: radio-spectral-index maps (α-maps) are represented with the colour-map; the colour bar on the right shows the radio spectral index values from low (flat α) to high values (steep α). Overlaid, the radio contours at 1.49 GHz (black dashed) and at 8.44 GHz (white solid; original unsmoothed maps), where the contour levels scale as log10 of the flux density from the lowest flux value (3σ) to the highest. On the bottom right we give a scale-bar of 2 arcsec, as visual aid. Middle: The error map for the radio spectral index per pixel value. The colour bar on the right shows the range of values. Contours as on the left. In both plots, on the bottom left corner we give the beam of the 1.49 GHz map as black circle, and the beam of the 8.44 GHz map as grey circle/ellipse. On the bottom right we give a scale-bar of 2 arcsec, as visual aid. Right: histograms of the α-maps: Top histograms of the radio spectral index, based on Fig. A.1-left. Middle: histograms where the errors on α (Fig. A.1-middle) have been added. Bottom: histograms where the errors on α have been subtracted. |
| Open with DEXTER | |
Mrk 0331. This is the north companion of a galaxy system. At 8.44 GHz we see a ring-structure. The α-map and histogram show a flat centre steepening outwards with values of α getting much higher than 1.1. We classify it as a radio-AGN. We note that in the mid-IR this is a SB, and a Seyfert 2 in the optical.
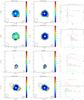 |
Fig. A.1
continued. |
| Open with DEXTER | |
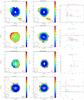 |
Fig. A.1
continued. |
| Open with DEXTER | |
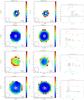 |
Fig. A.1
continued. |
| Open with DEXTER | |
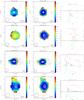 |
Fig. A.1
continued. |
| Open with DEXTER | |
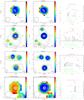 |
Fig. A.1
continued. |
| Open with DEXTER | |
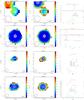 |
Fig. A.1
continued. |
| Open with DEXTER | |
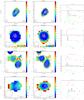 |
Fig. A.1
continued. |
| Open with DEXTER | |
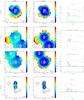 |
Fig. A.1
continued. |
| Open with DEXTER | |
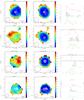 |
Fig. A.1
continued. |
| Open with DEXTER | |
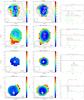 |
Fig. A.1
continued. |
| Open with DEXTER | |
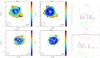 |
Fig. A.1
continued. |
| Open with DEXTER | |
© ESO, 2015
Current usage metrics show cumulative count of Article Views (full-text article views including HTML views, PDF and ePub downloads, according to the available data) and Abstracts Views on Vision4Press platform.
Data correspond to usage on the plateform after 2015. The current usage metrics is available 48-96 hours after online publication and is updated daily on week days.
Initial download of the metrics may take a while.