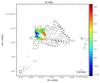
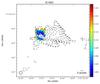
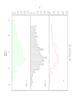
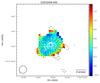
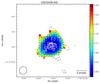
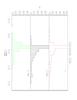
Fig. A.1
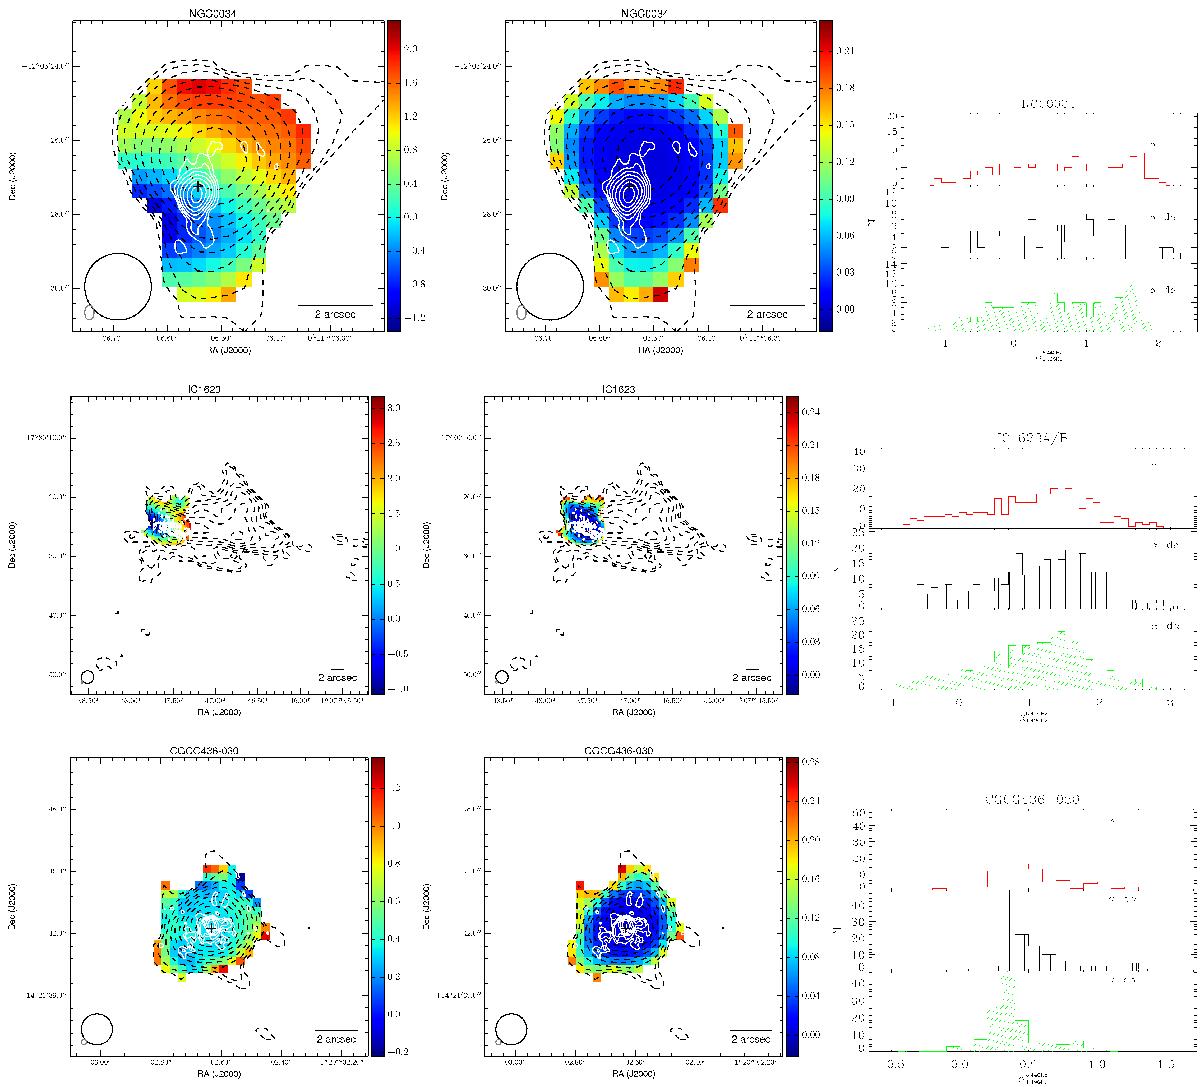
Each row corresponds to one object or system from our sample. Left: radio-spectral-index maps (α-maps) are represented with the colour-map; the colour bar on the right shows the radio spectral index values from low (flat α) to high values (steep α). Overlaid, the radio contours at 1.49 GHz (black dashed) and at 8.44 GHz (white solid; original unsmoothed maps), where the contour levels scale as log10 of the flux density from the lowest flux value (3σ) to the highest. On the bottom right we give a scale-bar of 2 arcsec, as visual aid. Middle: The error map for the radio spectral index per pixel value. The colour bar on the right shows the range of values. Contours as on the left. In both plots, on the bottom left corner we give the beam of the 1.49 GHz map as black circle, and the beam of the 8.44 GHz map as grey circle/ellipse. On the bottom right we give a scale-bar of 2 arcsec, as visual aid. Right: histograms of the α-maps: Top histograms of the radio spectral index, based on Fig. A.1-left. Middle: histograms where the errors on α (Fig. A.1-middle) have been added. Bottom: histograms where the errors on α have been subtracted.
Current usage metrics show cumulative count of Article Views (full-text article views including HTML views, PDF and ePub downloads, according to the available data) and Abstracts Views on Vision4Press platform.
Data correspond to usage on the plateform after 2015. The current usage metrics is available 48-96 hours after online publication and is updated daily on week days.
Initial download of the metrics may take a while.