| Issue |
A&A
Volume 568, August 2014
|
|
|---|---|---|
| Article Number | A26 | |
| Number of page(s) | 22 | |
| Section | Galactic structure, stellar clusters and populations | |
| DOI | https://doi.org/10.1051/0004-6361/201423856 | |
| Published online | 08 August 2014 | |
Online material
Appendix A: Temperature scale
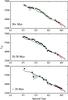 |
Fig. A.1
Spectral type versus effective temperature for all stars used in this analysis. The stars have been binned in three different age bins, as indicated in each panel. The grey shaded area represents the range of values within each spectral bin; the black marker is the mean value. Also plotted are the results of Pecaut & Mamajek (2013) – green line, Luhman et al. (2003) – dotted blue line, and Bayo et al. (2011) – solid red line for comparison. |
| Open with DEXTER | |
The way in which the mass distribution (Fig. 2) of our sample was determined was based on effective temperature values in combination with model predictions. When there was no effective temperature value from da Silva et al. (2009), we used the spectral type of that target as an indication for its effective temperature and took the median value for all available targets with the same spectral type in that age bin. If there were no other targets within that spectral type bin a value was constructed through linear interpolation, using the nearest earlier- and later-spectral type. Figure A.1 shows the range of effective temperature and spectral type values.
The spread in effective temperature in each spectral type bin, as shown by the grey shaded areas, is generally small across all three age bins, for example, for the later-types, which is smaller than the spread for younger objects reported in Bayo et al. (2011), which are up to ±150 K. The largest apparent spread is for the G3 spectral type bin at <20 Myr; it is caused by two values: 4722 K and 5759 K. The result is anomalous, and therefore, any necessary interpolation within the regime G2-G8 was conducted linearly using the two effective temperature values of 5988 K and 5344 K as boundaries, which is in accordance with the trend of the data.
Appendix B: Notes on individual sources
In Appendix B.1 we comment on the individual sources that show RV variation above σs, 0.89 km s-1. Appendix B.2 shows the results from an archival search for any existing multiplicity flags. In Appendix B.3 we comment on the data used to identify SB2 and SB3 systems in this work. Appendix B.4 describes further analysis conducted in the cases of potential SB2/SB3 systems to remove false detections from deformities in the CCF profiles.
Appendix B.1: Archival RV values
Values quoted below, calculated in this work, are average values from all available UVES and FEROS data; their uncertainties are one standard deviation in the following form: RV ±σ km s-1.
HD 59169: there are only two available epochs for this object: one is from UVES data and the other is FEROS data producing a value of 34.3 ± 5.4 km s-1. However, this is a significant change in RV, and therefore, it remains a potential multiple system.
AU Mic: there are four data epochs in our own dataset, three from UVES, one from FEROS (−5.1,− 5.2, −4.9, and −4.0 km s-1) producing a value of − 4.8 ± 0.5 km s-1, which is not a significant variation. If one looks at the values from the literature (1.2 ± 1.3, 15.6 and − 4.5 ± 1.3 km s-1) there is one value that is significantly different from the others, 15.6. However, after private communication with John E. Gizis, it is apparent that the 1σ uncertainties are ≈17 km s-1, making this value compatible with all others. Therefore, this target is not considered as a multiple system candidate.
V1005 Ori: this target has a value of 19.0 ± 0.3 km s-1 from three UVES epochs, which is a variation well below 1σs. However, there are seven values from the literatures; which when evaluated together show clear RV variability. Therefore, this target is considered a multiple system candidate.
GSC 09420-00948: there are four UVES data epochs for this target, producing a value of 12.7 ± 3.2 km s-1. In combination with this, there are two values from Malaroda et al. (2006): 5.0 and 17.1 km s-1. However, these do not have any quoted uncertainties. Because the variation in RV value is larger than σs, even without the use of archival data, it remains a potential multiple system.
HD 104467: this target has a value of 13.3 ± 3.1 km s-1 from both UVES and FEROS data. There are also two values from VizieR: 12.3 ± 1.4 (Torres et al. 2006) and 15.4 ± 1.0 km s-1 (Kharchenko et al. 2007). The values from the literature are consistent with our derived values but this target remains a potential multiple system due to the high standard deviation.
CD-363202: this target only has one observation one from FEROS data, producing a value of 5.2 ± 0.9 km s-1 and one value from the catalogue search, 25.6 ± 1.0 km s-1 (Torres et al. 2006). This is a huge variation in RV; however, it has an extremely high vsini value of 170 ± 17 km s-1 (Torres et al. 2006), which severely limits the accuracy of the RV determination. For this reason it is not considered as a multiple system candidate.
AK Pic: there are two observations for this target producing a value of 35.9 ± 0.9 km s-1. There are six values from VizieR; four of which have associated uncertainties: 32.3 ± 0.4, 32.1 ± 0.5, 32.2 ± 1.5, and 28.1 ± 2.1 km s-1. These are more than 3σ, <33.1 km s-1, below our derived value, using their upper uncertainty limits. Therefore, this target is a potential multiple system.
BD+012447: this target only has one value calculated in this work, 7.7 ± 0.9 km s-1. However, there are seven values from VizieR, two of which have associated uncertainties: 8.3 ± 0.2 and 9.1 ± 0.6 km s-1. These values agree with our derived values, and therefore, this target is not considered as a multiple system candidate.
CD-2711535: there are two observations for this target; it has a calculated RV value of −6.9 ± 1.4 km s-1. This standard deviation is well above the average for the sample (0.89 km s-1). There are also two values in VizieR, −6.4 ± 1.0 and −1.1 ± km s-1 from Torres et al. (2006) and Song et al. (2012), respectively. The latter value significantly varies from our derived value, and therefore, this target is considered a potential multiple system.
GJ 3305: this target has three observations. It has a calculated RV value of 23.8 ± 0.5 km s-1. There is one value in VizieR 17.6 km s-1 from Reid et al. (1995). However, after private communication with John E. Gizis, it is apparent that the 1σ uncertainties are ≈17 km s-1 for this work, and, therefore, this apparent variation is consistent. It is not considered as a member of β-Pic with new RV data from this work. It is a known extremely eccentric multiple system with an eccentricity of 0.06 and a period of 21.5 yr (Delorme et al. 2012).
BD-211074B: this target has three observations; it has a calculated RV value of 21.6 ± 0.6 km s-1. There are two values from the VizieR 20.0 and 31.7 km s-1 from Reid et al. (1995). However, after private communication with John E. Gizis, it is apparent that the 1σ uncertainties are ≈17 km s-1 for this work, and therefore, this apparent variation is consistent. Therefore, this target is not considered as a multiple system candidate.
PX Vir: Griffin (2010) determined the spectroscopic orbit of this system (216.48 day). In addition to this, we have one value of −13.3 ± 0.89 km s-1, and there are ten values from the VizieR, of which six have associated uncertainties. There are two values from Maldonado et al. (2010) that have a huge variation, which are much higher than the level of uncertainty at −13.1 ± 0.1 and −2.6 ± 0.1 km s-1, and agrees with the work of Griffin (2010). Therefore, this target is classified as a multiple system in this work.
GSC 08077-01788: this target has two observations; it has a calculated RV value of 17.6 ± 0.8 km s-1. There are two values from VizieR, (Torres et al. 2006): 24.0 ± 1.0 km s-1 and (Kordopatis et al. 2013): −6.9 ± 4.1 km s-1. This is a very large variation, and therefore, this target is considered a multiple system in this work.
Details of all initially flagged potential multiple systems.
Appendix B.2: Archival multiplicity flags
In addition to querying for any existing RV values, we also queried for multiplicity flags from catalogues using VizieR (Dommanget & Nys 2002; Malkov et al. 2006; Pourbaix et al. 2004; Worley & Douglass 1996), whether the system has previously been identified to have one or more companions. Out of our sub-sample of the overall SACY sample and probing only the SB systems, we found the previous multiplicity results:
HD 33999: this is a previously known triple-lined system (Dommanget & Nys 2002) which has been flagged in previous SACY work and identified in this work as well.
PX Vir: as discussed in Sect. B.1, this is a previously identified spectroscopic multiple system which agrees with the variation seen in our catalogue search.
Appendix B.3: Definite SB2 and SB3 candidates
Below are any details on the data of postively identified SB2 and SB3 candidates; these targets show a clear double peak in the output of the CCF. The literature was also queried to use any potential existing information.
HD 155177: there are four available data epochs for this object over a wide range of dates (2007-04-19, 2008-10-26, 2012-05-09, and 2012-06-14). There are two clear peaks that vary across the data epochs indicating strong it is a binary system. No obvious note of spectroscopic multiplicity in the literature.
HD 33999: as mentioned in Appendix B.2, this is a previously known triple-lined multiple system.
HD 309751: there is only one epoch of data available for this object (2011-11-20); however, the produced CCF profile is extremely clear to identify it as an SB2 system. Torres et al. (2006) identified this as an SB2 system.
BD-20951: there are two epochs of data for this target (2012-07-17, 2012-07-31). There are two clear peaks in the CCFs, indicating strongly it is a bound binary system. To the best of our knowledge, there is no note of spectroscopic multiplicity in the literature.
V4046-Sgr: there are a great many data epochs for this object and it is a well known and studied spectroscopic binary system (e.g., Quast et al. 2000; Argiroffi et al. 2012; Donati et al. 2011).
HD 217379: there is only one epoch of data for this object (2010-05-25). Despite this, the CCF provides a clear result that this is a triple-lined system; the signal-to-noise is ~200, and all three peaks are well above the noise level. Torres et al. (2006) identified this as a triple-lined (SB3) spectroscopic system.
TWA 14: there are two data epochs available for this object (2012-05-22, 2012-06-04). The output of the CCF shows two peaks; however the profiles are merged. The two peaks have different depths in each data epoch and appear to switch position between the two epochs, indicating it is a bound binary system. Weinberger et al. (2013) and identified Jayawardhana et al. (2006) this as a double-lined (SB2) system.
TWA 20: there are three epochs of data for this target (2012-05-07, 2012-05-22, and 2012-07-03). There are two strong peaks in all of the CCFs from the RED arm of UVES; the blue is very noisy due to the spectral type of the star, M3. In addition, Jayawardhana et al. (2006) identify this is a SB2 system, and therefore, it is classified as an SB2 system in this work; however it is not considered a member of TW-Hydrae with new RV values.
1RXS J195602.8-320720: there is one epoch of data for this target (2011-10-09). The spectral type of the star is M4, and therefore, the CCF output is quite noisy; however, there is a clear second peak above the level of the noise in both the results from the RED arm of UVES. To the best of our knowledge, there is no note of spectroscopic multiplicity in the literature.
Appendix B.4: Questionable SB2 and SB3 candidates
Initially, some targets were flagged as potential multiple systems, as shown in Table B.1. The targets CD-423328, CD-542644 and CP-551885 have previously been identified as having variable rotational behaviour due to the presence of spots (Kiraga 2012). However, this does not exclude the possibility that they are multiple systems; therefore, we conduct the same analysis for these targets as for those without any variability flag.
For the targets shown in Table B.1, we conducted the following analysis to determine whether the deformity could be the solely the result of spots on the surface of the star.
The intensity of Ca II H (3968.5 Å) and Ca II K (3933.7 Å) emission respond to the amount of non-thermal heating of the chromosphere, which can be caused by areas of concentrated magnetic field (Leighton 1959); therefore, there is a strong link between spot coverage and activity. We can use this to our advantage in our CCF output to differentiate between spots and merged-SB2 components.
We fitted one Gaussian profile to the CCF output, assuming it was a single star, producing a system velocity (vsys) and then looked for the specific velocities of the deformities in the profile (vd1,vd2, etc.). We then compared the system velocity and deformity velocity values to the line profiles of Ca II H and K; the chromosphere can emit isotropically at the sytem velocity and have components of emission from the strong areas of magnetism, corresponding to the deformity velocities. If the Ca II H and K lines had a multiple-component structure with peaks corresponding to the values of vsys and vd1,vd2 etc. then it is very likely that the candidate multiple system is a single system with strong activity. If this was not the case but the profiles of Ca II H and K had a multiple component structure, we also checked whether the multiple components had peak values corresponding to a multiple-line fit to the CCF, which assume the system is multiple.
The graphs presented in this section are in the following format. There are four panels for each UVES observation from left to right (1−4).
-
Panel 1: the CCF output for the BLUE chip of UVES (blue line)and single Gaussian fit (black line). Phase values, φ, are shown fromTable B.1 where available.
-
Panel 2: the residuals from each of the fits, all graphs have the same y-axis range for easy comparison of the goodness of fit. The parameter σ represents the average standard deviation in the residuals from the fit.
-
Panel 3: the normalised flux of chromospheric line Ca II H, 3968.5 Å, in velocity space (black line); overplotted is the normalised and reversed CCF profile from Panel 1 (blue dotted line) as well as vsys and vd1,2 (red vertical lines).
-
Panel 4 has the same format are Panel 3 but is at 3933.7 Å, for the chromospheric line Ca II K.
TYC 7605-1429-1: this target was initially identified as a binary candidate due to its abnormal CCF profile. However, TYC 7605-1429-1 only has one epoch of data, which is not conclusive from this analysis, as shown in Fig. B.1. It has an extremely broad component with a FWHM of ≈62 km s-1, making the RV determination difficult. Torres et al. (2006) quote a value of 28.6 km s-1 which agrees with our derived value of 31.2 ± 4.0 km s-1. Messina et al. (2010) flagged this target as a single system.
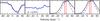 |
Fig. B.1
TYC 7605-1429-1: 2012-09-22. |
| Open with DEXTER | |
HD 30051: there are three available epochs for this target, 2012-07-30, 2012-07-31, and 2012-08-01. This is an F2-type star, and therefore, does not have strong chromopsheric activity, as shown in the lack of emission in Panels 3 and 4 of Fig. B.2. This star was initially classified as a multiple system due to the two component structure of the CCF profile, which potentially consists of a rapid rotator, producing the broad component with a slower-rotating companion, narrow component. However, there is no significant variation in system velocity (−1.5, −2.1 and, −2.5) between observations, making it extremely unlikely to be a close binary system with period >1 day.
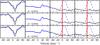 |
Fig. B.2
HD 30051: 2012-07-30, 2012-07-31, and 2012-08-01. |
| Open with DEXTER | |
CD-542644: there are two epochs for this target 2009-03-08 and 2011-11-20, as seen in Fig. B.3. The velocities for vsys and vd1 do not correspond well to the shape of the line profiles. The CCF profiles are also quite complex, making it hard to determine the correct velocities. Based on this analysis, we do not consider this target a multiple system.
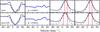 |
Fig. B.3
CD-542644: 2009-03-08, and 2011-11-20. |
| Open with DEXTER | |
CP-551885: there are two epochs for this target 2009-03-08 and 2011-11-20, as seen in Fig. B.4. The line profiles displayed in panels 3 and 4 show a clear two component structure. However, the picture we have is confusing; the vsys value agrees well in both epochs; however, vd1 does not. Instead, it is one of the velocities fitted using two Gaussians that matches with the secondary peak ≈5 km s-1. In addition to this, if we look at the vsys values, there is no considerable variation: 27.6 (φ = 0), 21.5 (φ = 0.674) and (Torres et al. 2006) 23.1 km s-1 from previous work, assuming the period of rotation is synchronised with the orbital period. Based on these arguments, we do not consider this target a multiple system.
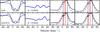 |
Fig. B.4
CP-551885: 2009-03-08, and 2011-11-20. |
| Open with DEXTER | |
CD−423328: there are two epochs for this target 2012−09−05 and 2012−09−09, as seen in Fig. B.5. The lines from a two−component Gaussian fit agree with the peaks seen in the profiles of Ca II H and K. Torres et al. (2006) also quote a value of 24.6 ± 1.0 km s-1, which is hugely different from our value derived from a single Gaussian fit (15.2 ± 0.1 km s-1). Kiraga (2012) classified this object as rotationally variable due to the presence of spots; however, this does not exclude the possibility that it is a binary system. Due to this line−profile analysis and the variation in RV value, this target is classified as a potential multiple system.
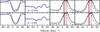 |
Fig. B.5
CD-423328: 2012-09-05, and 2012-09-09. |
| Open with DEXTER | |
CD-433604: there are three available epochs for this target, 2009-02-14, 2012-09-05, and 2012-09-09, as seen in Fig. B.6. It is extremely unlikely that it is an SB2 system, as the flux ratio of the two components is variable epoch to epoch (0.97, 0.64, 0.56 respectively). The line profile analysis is inconclusive; epochs 2012-09-05 and 2012-09-09 show a two-component structure in Ca II H and K; however, the derived vsys and vd1 values do not correspond to the peaks of these components. The calculated RV values (20.4, 24.1, and 11.0) are extremely variable, but the fits are poor, as seen in panel 2 of Fig. B.6. There is one other existing value (C. A. O. Torres, priv. comm.) of 21.4, and therefore, if one considers three of the four values to compute an average, there is no significant variation (22.0 ± 1.9 km s-1). At this time, the evidence for multiplicity is not strong enough for us to consider this target as a multiple system.
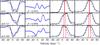 |
Fig. B.6
CD-433604: 2009-02-14, 2012-09-05, and 2012-09-09. |
| Open with DEXTER | |
GSC 09239-01572: there are four epochs available for this object, 2010-05-24, 2012-01-21, 2012-02-21, and 2012-02-22. In Fig. B.7, one can see the agreement between the deformity velocities and the line profiles of Ca II H and K is extremely good for all four epochs. On this basis, we conclude that the CCF profile is the result of star spots as opposed to multiplicity.
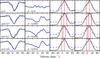 |
Fig. B.7
GSC 09239-01572: 2010-05-24, 2012-01-21, 2012-02-21, and 2012-02-22. |
| Open with DEXTER | |
TYC 7627-2190-1: there are two epochs available for this object: 2009-03-06 and 2010-08-08, as seen Fig. B.8. From the fitting of a single system velocity to the profiles there is no significant variation betwen the observations (25.6 and 27.2). The value of the system velocity is extremely close to that of the deformity velocity; this makes it extremely difficult to see the separate components in this analysis. However, we only have two epochs, and therefore based on this evidence, we do not classify this as a multiple system.
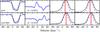 |
Fig. B.8
TYC 7627-2190-1: 2009-03-06, and 2010-08-08. |
| Open with DEXTER | |
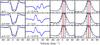 |
Fig. B.9
TYC 8594-58-1: 2009-02-18, 2012-06-04, and 2012-06-29. |
| Open with DEXTER | |
TYC 8594-58-1: there are three epochs of data for this target: 2009-02-18, 2012-06-04 and 2012-06-29. However, much like TYC7627-2190, the value of the deformity velocity is extremely close to the system velocity, and therefore, seeing the two components separately is extremely difficult. There is no significant variation in the system velocity between all three epochs (10.8, 8.2, and 10.9, respectively). Figure B.9 also shows the velocities when fitting the CCF with two Gaussians, as shown as black vertical lines. Neither of these techniques provide strong evidence for or against the multiplicity of the system. Therefore, as it statistically much more likely to be a single system, it is not considered a multiple system in this work.
Appendix C: Radial velocity values.
RV values from each UVES observation available.
© ESO, 2014
Current usage metrics show cumulative count of Article Views (full-text article views including HTML views, PDF and ePub downloads, according to the available data) and Abstracts Views on Vision4Press platform.
Data correspond to usage on the plateform after 2015. The current usage metrics is available 48-96 hours after online publication and is updated daily on week days.
Initial download of the metrics may take a while.