Fig. A.1
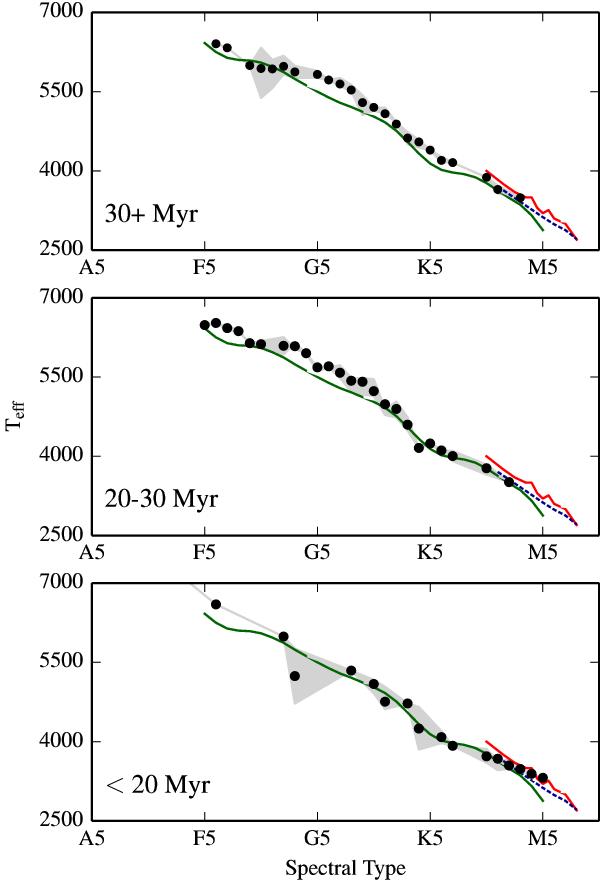
Spectral type versus effective temperature for all stars used in this analysis. The stars have been binned in three different age bins, as indicated in each panel. The grey shaded area represents the range of values within each spectral bin; the black marker is the mean value. Also plotted are the results of Pecaut & Mamajek (2013) – green line, Luhman et al. (2003) – dotted blue line, and Bayo et al. (2011) – solid red line for comparison.
Current usage metrics show cumulative count of Article Views (full-text article views including HTML views, PDF and ePub downloads, according to the available data) and Abstracts Views on Vision4Press platform.
Data correspond to usage on the plateform after 2015. The current usage metrics is available 48-96 hours after online publication and is updated daily on week days.
Initial download of the metrics may take a while.