| Issue |
A&A
Volume 566, June 2014
|
|
|---|---|---|
| Article Number | L10 | |
| Number of page(s) | 6 | |
| Section | Letters | |
| DOI | https://doi.org/10.1051/0004-6361/201423850 | |
| Published online | 27 June 2014 | |
Online material
Appendix A: Supporting figures
This appendix contains Figs. A.1–A.3 that are analogous to Fig. 1. These figures unambiguously show the modulations discovered. The full dataset employed to create these figures is made publicly available through the CDS.
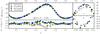 |
Fig. A.1
New Coralie RV data for QZ Nor (N = 125). The large panel shows the phased RV curve, distinguishing data from different epochs by symbol style and color. The two right-hand panels provide close-ups around maximum (upper) and minimum RV (lower), and show the median RV uncertainty as a blue errorbar. The bottom panel shows residuals around an “average” Fourier series model fit to the combined data set (fit procedure described in Anderson et al. 2013). |
| Open with DEXTER | |
 |
Fig. A.2
Analogous to Fig. A.1 using RV data for V335 Puppis (N = 95). |
| Open with DEXTER | |
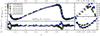 |
Fig. A.3
Analogous to Fig. A.1 using RV data for RS Puppis (N = 439). RS Puppis also exhibits significant random cycle-to-cycle fluctuations in pulsation period (Berdnikov et al. 2009). As the close-up panels demonstrate, these random period fluctuations occur in addition to the modulation of the RV amplitude. |
| Open with DEXTER | |
Finally, Fig. A.4 shows the residuals of the models fit to the per-epoch data used to estimate the impact of modulation as a systematic uncertainty for Baade-Wesselink distances, cf. Table 1. The data were modeled as cubic splines for QZ Nor, ℓ Car, and RS Pup, and as a second-order Fourier series for the s-Cepheid V335 Pup.
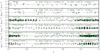 |
Fig. A.4
Fit residuals from the epochs (E1 and E2) used to estimate the impact on BW distances for all four Cepheids, cf. Table 1. For ℓ Car and RS Pup, both the cycle-to-cycle and longer timescales are shown. The earlier epoch is represented by green x markers, the later epoch by black open circles. For each epoch, the rms around the fit and median measurement uncertainty, ⟨ σ ⟩, are printed in the corresponding panel, indicating excellent fits. |
| Open with DEXTER | |
© ESO, 2014
Current usage metrics show cumulative count of Article Views (full-text article views including HTML views, PDF and ePub downloads, according to the available data) and Abstracts Views on Vision4Press platform.
Data correspond to usage on the plateform after 2015. The current usage metrics is available 48-96 hours after online publication and is updated daily on week days.
Initial download of the metrics may take a while.