| Issue |
A&A
Volume 566, June 2014
|
|
|---|---|---|
| Article Number | A37 | |
| Number of page(s) | 30 | |
| Section | Galactic structure, stellar clusters and populations | |
| DOI | https://doi.org/10.1051/0004-6361/201323198 | |
| Published online | 04 June 2014 | |
Online material
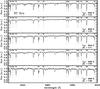 |
Fig. 1
High-resolution (R ~ 38 000) UVES spectra of solar metallicity Galactic Cepheid RY Sco ([Fe/H] = 0.01 ± 0.06). From top to bottom the spectra were plotted for increasing pulsational phase (see the corresponding Teff curve in Fig. 3). The S/N of this sample is around 100 in the spectral range λ ~ 5650–7500 Å. The vertical dashed lines display selected Fe I (λλ5930.17, 5934.66, 5952.73, 5956.7, 5975.35, 5976.78, 5983.69, 5984.79, 5987.05, 5997.78 Å) and Fe II (λλ5932.06, 5991.37 Å) lines included in our abundance analysis (see Table 1 and Romaniello et al. 2008). |
| Open with DEXTER | |
Intrinsic parameters and abundances for the current sample of classical Cepheids based on individual spectra.
Mean NIR magnitudes, mean distances and mean iron abundances for the current sample of classical Cepheids.
Galactic Cepheids for which the iron abundance was available in the literature.
Individual ages, distances, and metallicities for the current sample of open clusters.
Structural parameters and metallicities of the candidate Cepheid groups.
Intrinsic parameters for field and cluster (NGC 1850, NGC 1866) Magellanic Cepheids with accurate iron abundances.
© ESO, 2014
Current usage metrics show cumulative count of Article Views (full-text article views including HTML views, PDF and ePub downloads, according to the available data) and Abstracts Views on Vision4Press platform.
Data correspond to usage on the plateform after 2015. The current usage metrics is available 48-96 hours after online publication and is updated daily on week days.
Initial download of the metrics may take a while.