Fig. 1
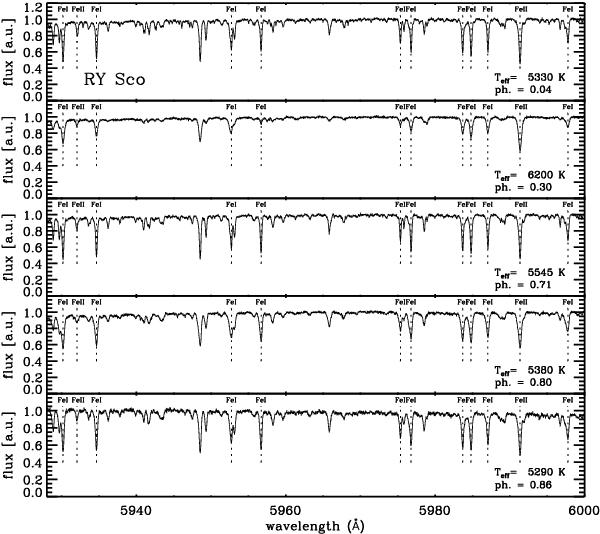
High-resolution (R ~ 38 000) UVES spectra of solar metallicity Galactic Cepheid RY Sco ([Fe/H] = 0.01 ± 0.06). From top to bottom the spectra were plotted for increasing pulsational phase (see the corresponding Teff curve in Fig. 3). The S/N of this sample is around 100 in the spectral range λ ~ 5650–7500 Å. The vertical dashed lines display selected Fe I (λλ5930.17, 5934.66, 5952.73, 5956.7, 5975.35, 5976.78, 5983.69, 5984.79, 5987.05, 5997.78 Å) and Fe II (λλ5932.06, 5991.37 Å) lines included in our abundance analysis (see Table 1 and Romaniello et al. 2008).
Current usage metrics show cumulative count of Article Views (full-text article views including HTML views, PDF and ePub downloads, according to the available data) and Abstracts Views on Vision4Press platform.
Data correspond to usage on the plateform after 2015. The current usage metrics is available 48-96 hours after online publication and is updated daily on week days.
Initial download of the metrics may take a while.