| Issue |
A&A
Volume 566, June 2014
|
|
|---|---|---|
| Article Number | A66 | |
| Number of page(s) | 18 | |
| Section | Stellar atmospheres | |
| DOI | https://doi.org/10.1051/0004-6361/201322697 | |
| Published online | 17 June 2014 | |
Online material
Appendix A: The IHα hydrogen line based activity index
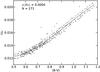 |
Fig. A.1
Calibration of Hα index as a function of (B − V) colour. The solid curve line is the best fit to the data and the dashed lines correspond to the 1–σ limits. |
| Open with DEXTER | |
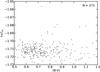 |
Fig. A.2
Dependence of the log IHα index on stellar colour. |
| Open with DEXTER | |
The Hα index is calculated from the fraction of the flux in the Hα line centre to the flux in two continuum reference bands, where one bluer other redder than the hydrogen line. This is sufficient if we are interested in determining the activity evolution over time for a star. However, stars with different colours have different amounts of flux in the continuum, and this makes the average Hα level not comparable between different stars due to a systematic error introduced by the photospheric flux interference in the measurements (e.g. Cincunegui et al. 2007).
To be able to compare the average Hα index between different stars, the photospheric contribution to the index needs to be taken into account. Figure A.1 shows the calibration of Hα to the effects of stellar colour. We fitted Hα to (B − V) using a cubic
polynomial, which resulted in a standard deviation of the fit of 0.0004. Our corrected IHα activity index is then  (A.1)Figure A.2 shows that the resulting index is not dependent on (B − V) and can therefore be used to compare the activity level of stars of different colour. This calibration is valid for main sequence stars with (B − V) colour between 0.5 and 1.2 and has mean Hα activity levels between 0.012 and 0.021.
Appendix B: Estimating effective temperature using the flux in Hα line
The Hα line wings are known to be a proxy of effective temperature (e.g. Fuhrmann et al. 1993; Barklem et al. 2002) and are sometimes used to confirm more accurate results by other methods. For example, Bouchy et al. (2008) used the wings of the Hα line to derive a temperature of 5450 ± 120 K for the star CoRoT-Exo-2. Sozzetti et al. (2007) compared the Hα wings to those of synthetic spectra to obtain a temperature region of 5750−6000 K for TrES-2 (other authors that used the same technique as a rogue estimate of temperature include Santos et al. 2006; Sozzetti et al. 2009).
We found that our Hα activity index is also a good proxy of Teff. Figure B.1 shows a quadratic fit to the correlation between these parameters. Active stars (open circles) were not used due to their contribution to a larger scatter. We obtained an rms of the Teff residuals of σ = 68 K, and a correlation coefficient of ρ = −0.96. The calibrated Teff is of the form  (B.1)This equation can be used for dwarfs with log IHK ≤ − 4.70, mean Hα activity in the range 0.012 ≤ Hα ≤ 0.021, and effective temperatures in the range 4600 ≤ Teff ≤ 6280 K.
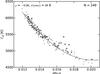 |
Fig. B.1
Calibration of Teff by using Hα activity index for all main sequence stars except the most active (log IHK ≥ − 4.75, open circles). The grey line is the best quadratic fit to the data. |
| Open with DEXTER | |
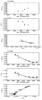 |
Fig. B.1
Time-series of |
| Open with DEXTER | |

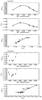 |
Fig. B.1
continued. |
| Open with DEXTER | |
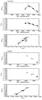 |
Fig. B.1
continued. |
| Open with DEXTER | |
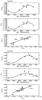 |
Fig. B.1
continued. |
| Open with DEXTER | |
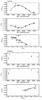 |
Fig. B.1
continued. |
| Open with DEXTER | |
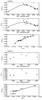 |
Fig. B.1
continued. |
| Open with DEXTER | |
Parameters for the 66 stars with | ρ | ≥ 0.5 from the nightly averaged 271-star sample.
Parameters for the 205 stars with |ρ| ≤ 0.5 from the nightly averaged 271-star sample.
© ESO, 2014
Current usage metrics show cumulative count of Article Views (full-text article views including HTML views, PDF and ePub downloads, according to the available data) and Abstracts Views on Vision4Press platform.
Data correspond to usage on the plateform after 2015. The current usage metrics is available 48-96 hours after online publication and is updated daily on week days.
Initial download of the metrics may take a while.