| Issue |
A&A
Volume 566, June 2014
|
|
|---|---|---|
| Article Number | A140 | |
| Number of page(s) | 32 | |
| Section | Cosmology (including clusters of galaxies) | |
| DOI | https://doi.org/10.1051/0004-6361/201322459 | |
| Published online | 26 June 2014 | |
Online material
Appendix A: Fossil group candidates
In Table A1 we present fossil group candidates catalog. Columns 1 and 2 are group id and the photometric redshift of group. Columns 3 and 4 present the BGG coordinate RA.(J2000) and Dec.(J2000) in degrees. Columns 5 and 6 are BGG r′-band magnitude and ΔM1,2. In Figs. A.1−A.23 we show the X-ray emission as contours overlaid on the CFHTLS RGB image (top panel) and the color magnitude diagrams of g′ − r′ and r′ − i′ versus z′ for z< 0.6 and r′ − i′ and i′ − z′ versus z′ for z> 0.6 for fossil group candidates listed in Table A.1.
In Sect. 5.2 we define a fossil group and the search radius used for the magnitude gap calculation. Group members selected using two colors according to the method described in Sect. 4.1. We show group members with filled black circles in each color magnitude diagrams. The first and second brightest galaxies are marked by red asterisks. The upper and lower limits of colors in each redshift have been shown with horizontal dotted blue lines.
As it can be seen in the color magnitude diagrams, in some galaxy groups there are galaxies outside the 0.5R200 that are brighter than the second galaxy which is used to compute the ΔM1,2. These groups are experiencing the infall of galaxies into search radius. This demonstrates that the magnitude gap estimate and the identification of fossil groups are very sensitive to the adopted search radius for selecting the second bright galaxy.
Fossil group candidates.
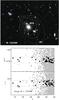 |
Fig. A.1
Upper panel: contours of the extended X-ray emission overlaid on the CFHTLS RGB image of the fossil group 101540 at z = 0.07. Middle panel: g′ − r′ versus z′. Lower panel: r′ − i′ versus z′. Filled black circles illustrate group members selected by the method described in Sect. 4.1. The BGG and second brightest satellite galaxy within 0.5R200 have been marked with red asterisks within each color magnitude diagram. The upper and lower limits of colors are shown by horizontal dashed lines. |
| Open with DEXTER | |
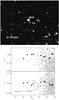 |
Fig. A.2
Same as in Fig. A.1, but for the group 101391 at z = 0.07. |
| Open with DEXTER | |
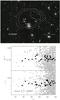 |
Fig. A.3
Same as in Fig. A.1, but for the group 102820 at z = 0.11. |
| Open with DEXTER | |
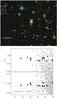 |
Fig. A.4
Same as in Fig. A.1, but for the group 100130, at z = 0.13. |
| Open with DEXTER | |
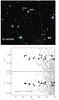 |
Fig. A.5
Same as in Fig. A.1, but for the group 103330 at z = 0.14. |
| Open with DEXTER | |
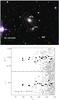 |
Fig. A.6
Same as in Fig. A.1, but for the group 101210 at z = 0.15. |
| Open with DEXTER | |
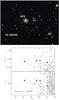 |
Fig. A.7
Same as in Fig. A.1, but for the group100150 at z = 0.16. |
| Open with DEXTER | |
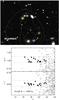 |
Fig. A.8
Same as in Fig. A.1, but for the group 100010, at z = 0.22. |
| Open with DEXTER | |
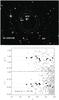 |
Fig. A.9
Same as in Fig. A.1, but for the group 102130 at z = 0.23. |
| Open with DEXTER | |
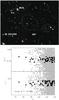 |
Fig. A.10
Same as in Fig. A.1, but for the group 101290 at z = 0.25. |
| Open with DEXTER | |
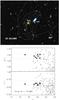 |
Fig. A.11
Same as in Fig. A.1, but for the group 101480, at z = 0.34. |
| Open with DEXTER | |
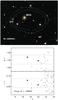 |
Fig. A.12
Same as in Fig. A.1, but for the group 100640, at z = 0.34. |
| Open with DEXTER | |
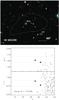 |
Fig. A.13
Same as in Fig. A.1, but for the group 101200 at z = 0.47. The 2nd brightest galaxy cannot be found inside 0.5R200 due to completeness effect and the galaxy marked is at a 0.6R200 distance to the center. |
| Open with DEXTER | |
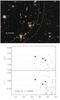 |
Fig. A.14
Same as in Fig. A.1, but for the group 103320 at z = 0.53. |
| Open with DEXTER | |
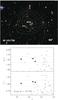 |
Fig. A.15
Same as in Fig. A.1, but for the group 101730, at z = 0.60. |
| Open with DEXTER | |
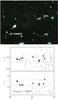 |
Fig. A.16
Upper panel: contours of extended X-ray emission overlaid on the CFHTLS RGB image of the fossil group 100620 at z = 0.66. Middle panel: i′ − z′ versus z′. Lower panel: r′ − i′ versus z′. Filled black circles illustrate group members selected by the method described in Sect. 4.1. The BGG and second brightest satellite galaxy within 0.5R200 have been marked with red asterisks within each color magnitude diagram. The upper and lower limits of colors have been shown by horizontal dotted blue lines. |
| Open with DEXTER | |
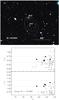 |
Fig. A.17
Same as in Fig. A.16, but for the group 101000 at z = 0.76. |
| Open with DEXTER | |
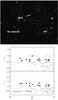 |
Fig. A.18
Same as in Fig. A.16, but for the group 101120 at z = 0.86. |
| Open with DEXTER | |
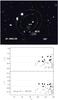 |
Fig. A.19
Same as in Fig. A.16, but for the group 100120 at z = 0.88. |
| Open with DEXTER | |
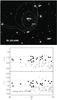 |
Fig. A.20
Same as in Fig. A.16, but for the group 101490, at z = 0.94. |
| Open with DEXTER | |
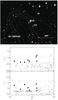 |
Fig. A.21
Same as in Fig. A.16, but for the group 100430, at z = 0.98. |
| Open with DEXTER | |
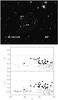 |
Fig. A.22
Same as in Fig. A.16, but for the group 101120, at z = 1.1. |
| Open with DEXTER | |
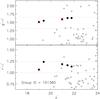 |
Fig. A.23
Same as in Fig. A.1, but for the group 101360, at z = 0.60. The RGB image of this group has been presented in Fig. 6 (bottom left panel). |
| Open with DEXTER | |
© ESO, 2014
Current usage metrics show cumulative count of Article Views (full-text article views including HTML views, PDF and ePub downloads, according to the available data) and Abstracts Views on Vision4Press platform.
Data correspond to usage on the plateform after 2015. The current usage metrics is available 48-96 hours after online publication and is updated daily on week days.
Initial download of the metrics may take a while.