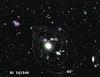
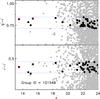
Fig. A.1
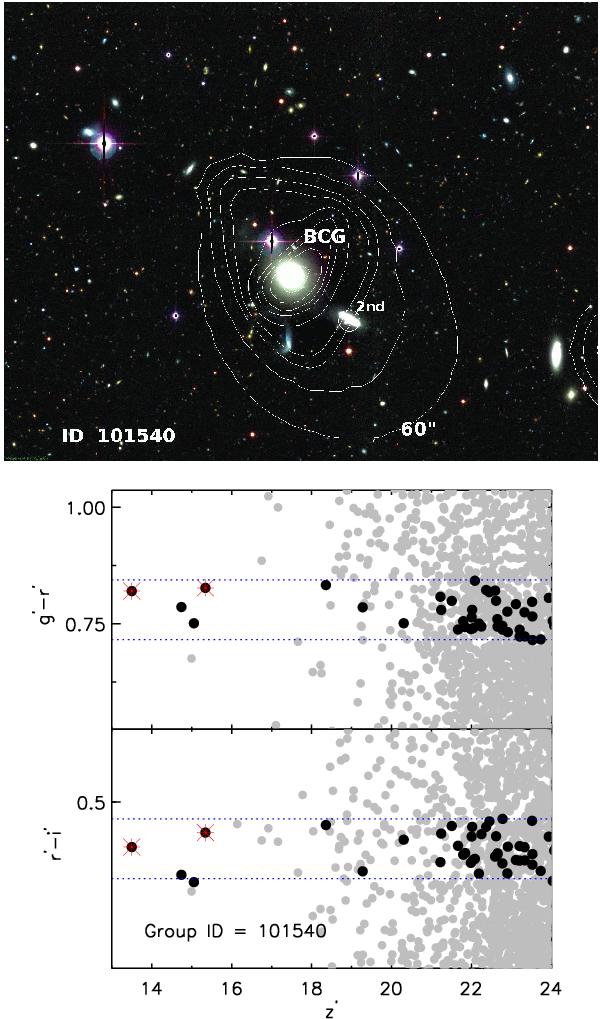
Upper panel: contours of the extended X-ray emission overlaid on the CFHTLS RGB image of the fossil group 101540 at z = 0.07. Middle panel: g′ − r′ versus z′. Lower panel: r′ − i′ versus z′. Filled black circles illustrate group members selected by the method described in Sect. 4.1. The BGG and second brightest satellite galaxy within 0.5R200 have been marked with red asterisks within each color magnitude diagram. The upper and lower limits of colors are shown by horizontal dashed lines.
Current usage metrics show cumulative count of Article Views (full-text article views including HTML views, PDF and ePub downloads, according to the available data) and Abstracts Views on Vision4Press platform.
Data correspond to usage on the plateform after 2015. The current usage metrics is available 48-96 hours after online publication and is updated daily on week days.
Initial download of the metrics may take a while.