| Issue |
A&A
Volume 564, April 2014
|
|
|---|---|---|
| Article Number | L4 | |
| Number of page(s) | 6 | |
| Section | Letters | |
| DOI | https://doi.org/10.1051/0004-6361/201423626 | |
| Published online | 28 March 2014 | |
Online material
Appendix A: Additional table and figures
The sample stars.
 |
Fig. A.1
Velocity law (velocity vs. distance from the star) in two of our AGB wind models. Both models are based on the MARCS hydrostatic model with Teff = 3500 K, log g = −0.5, and solar chemical composition. The red model is computed with velocity at infinite of 12 km s-1, mass-loss rate of 10-8 M⊙ yr-1, and β exponent of 0.2. The blue model has a velocity at infinite of 6 km s-1, mass-loss rate of 10-7 M⊙ yr-1, and β exponent of 1.0. We note that a smaller step is taken where the velocity gradient is steepest. |
| Open with DEXTER | |
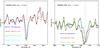 |
Fig. A.2
Rb I (left panel) and K I (right panel) line profiles obtained using dynamical models given by the (,Ṁ β) = (1 × 10⁻⁷, 0.2) pair (see Sect. 3.2) for the star IRAS 06300+6058. The hydrostatic model (blue line) is also shown for comparison. The colours have similar meaning in the two panels but in the case of K I, all models were computed with a sligthly higher terminal velocity of 15 kms-1, as suggested by the blue-shift of the K I line. We note that the red wing of the K I profile is not fully reproduced because of the presence of at least one interstellar component that is not seen in Rb I. |
| Open with DEXTER | |
 |
Fig. A.3
High-resolution optical spectra (in black) and dynamical models that provide the best fits (in red) in the ZrO 6474 Å region for our sample stars. Synthetic spectra obtained for Zr abundances shifted +0.25 dex (in blue) and +0.50 dex (in green) from the adopted values are also shown. |
| Open with DEXTER | |
Appendix B: Monte Carlo simulations
 |
Fig. B.1
Illustrative example of nine Monte Carlo simulations carried out with the envelope parameters T = 1000 K and vexp = 10 km s-1. The density (n, in cm-3) and the envelope size (Rmax, in cm) increase from left to right and from top to bottom, respectively. We show the displacement (in Angstroms) from the rest wavelength (Delta = λ − λ0, where λ0 is indicated by a vertical line) to the emergent wavelength distribution. |
| Open with DEXTER | |
© ESO, 2014
Current usage metrics show cumulative count of Article Views (full-text article views including HTML views, PDF and ePub downloads, according to the available data) and Abstracts Views on Vision4Press platform.
Data correspond to usage on the plateform after 2015. The current usage metrics is available 48-96 hours after online publication and is updated daily on week days.
Initial download of the metrics may take a while.