| Issue |
A&A
Volume 563, March 2014
|
|
|---|---|---|
| Article Number | A58 | |
| Number of page(s) | 30 | |
| Section | Extragalactic astronomy | |
| DOI | https://doi.org/10.1051/0004-6361/201322099 | |
| Published online | 06 March 2014 | |
Online material
Appendix A: Integrated near-IR spectra of the AMAZE and LSD galaxies
Figures A.1–A.4 show the integrated spectra of all galaxies in the AMAZE and LSD samples, restricted to the spectral regions that cover the nebular lines used to measure the metallicities.
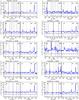 |
Fig. A.1
Near-IR spectra of the galaxies in the AMAZE sample. The vertical dashed lines indicate the expected location of nebular emission lines. The shaded vertical regions overlaid on each spectrum highlight spectral regions affected by strong sky emission lines. |
| Open with DEXTER | |
 |
Fig. A.2
Near-IR spectra of the galaxies in the AMAZE sample. The vertical dashed lines indicate the expected location of nebular emission lines. The shaded vertical regions overlaid on each spectrum highlight spectral regions affected by strong sky emission lines. |
| Open with DEXTER | |
 |
Fig. A.3
Near-IR spectra of the galaxies in the AMAZE sample. The vertical dashed lines indicate the expected location of nebular emission lines. The shaded vertical regions overlaid on each spectrum highlight spectral regions affected by strong sky emission lines. |
| Open with DEXTER | |
 |
Fig. A.4
Near-IR spectra of the lensed galaxies in the AMAZE sample. The vertical dashed lines indicate the expected location of nebular emission lines. The shaded vertical regions overlaid on each spectrum highlight spectral regions affected by strong sky emission lines. |
| Open with DEXTER | |
 |
Fig. A.5
Near-IR spectra of the galaxies in the LSD sample. The vertical dashed lines indicate the expected location of nebular emission lines. The shaded vertical regions overlaid on each spectrum highlight spectral regions affected by strong sky emission lines. |
| Open with DEXTER | |
Appendix B: Metallicity measurements
In this appendix we provide some additional details on the measurements of the gas metallicity. As mentioned in Sect. 5, the metallicities were inferred following the calibrations and the method described in detail in Maiolino et al. (2008). Here we briefly summarize the method and show the application to our full sample of galaxies. Maiolino et al. (2008) inferred the relationship between metallicity and various nebular line ratios by exploiting a combination of direct measurements (based on the Te method, mostly at low metallicities) and photoionization modeling (mostly at high metallicities). It has recently been argued that the excitation conditions in high-z galaxies are different from the local ones and that, therefore, the local calibrations may not apply to high redshift (Kewley et al. 2013). However, we found in a parallel work (Maiolino et al., in prep) that local calibrations are indeed appropriate for high-z galaxies, after selection effects are properly taken in to account. These relations are shown in Fig. B.1, where solid black lines show the average of the galaxy distribution and the dashed black lines show the dispersion. Each of these diagnostics has advantages and disadvantages. Some of them are practically unaffected by extinction (e.g., [OIII]/Hβ), but have a double-degenerate metallicity solution; others have a monotonic dependence on metallicity (e.g., [OIII]/[OII], [NeIII]/[OII]), but have high dispersion and are affected by reddening. However, when these diagnostics are used simultaneously, only some combinations of metallicity and reddening are allowed by the data. Obviously, not all of the diagnostics shown in Figs. B.1–B.5 are independent.
We decided to use the following independent metallicity diagnostics: R23 (which has the tightest relationship with metallicity, although with double solution), [OIII]/[OII] (which has a monotonic dependence on metallicity, although with large scatter, which allowed us to remove the degeneracy on R23), and, when available, [NeIII]/[OII] (which also has a monotonic dependence on metallicity). In practice, we determined the χ2 for each combination of metallicity and dust extinction for each of these relations, and found the best combination as the minimum of χ2.
The result of this method is shown, for each object in our sample, in Figs. B.1–B.5. The upper-left panel of the figure associated with each object shows in the metallicity-extinction plane the best-fitting value (blue cross) and the 1σ confidence level. Clearly, the metallicity is generally well constrained. The extinction is instead poorly constrained by this method; but this figure shows us that the uncertainties on extinction do not significantly affect the metallicity determination. In the other panels the vertical green error bar indicates the measured ratio with the associated uncertainties, while the blue cross gives the best-fit value of the metallicity and the dereddened ratio assuming the best-fit reddening value; the red lines show the projection of the 1σ confidence levels. The horizontal green error bar shows the resulting uncertainty on the metallicity.
While Figs. B.1–B.5 only show the results for the line ratios obtained from the integrated fluxes in each galaxy, the same method was applied pixel-to-pixel for resolved galaxies to infer the metallicity maps shown in Figs. 11–13.
 |
Fig. B.1
Diagnostic tools used to determine the metallicity of galaxies in the AMAZE sample. In each block, the top-left panel shows the best solution (blue cross) and the 1σ confidence level in the AV-metallicity plane. In the other panels the solid black line (best fit) and the dashed lines (dispersion) show the empirical relations between various line ratios and the gas metallicity. The green error bars show the observed ratios (along the y-axis) and the best-fit metallicity with uncertainty (along the x-axis); the blue cross shows the de-reddened ratios from adopting the best-fit extinction; the red line shows the projection of the 1σ uncertainty of the fit in the top-left panel. |
| Open with DEXTER | |
 |
Fig. B.2
Diagnostic tools used to determine the metallicity of the galaxies in the AMAZE sample. In each block, the top-left panel shows the best solution (blue cross) and the 1σ confidence level in the AV-metallicity plane. In the other panels the solid black line (best fit) and the dashed lines (dispersion) show the empirical relations between various line ratios and the gas metallicity. The green error bars show the observed ratios (along the y-axis) and the best-fit metallicity with uncertainty (along the x-axis); the blue cross shows the de-reddened ratios from adopting the best-fit extinction; the red line shows the projection of the 1σ uncertainty of the fit in the top-left panel. |
| Open with DEXTER | |
 |
Fig. B.3
Diagnostic tools used to determine the metallicity of the galaxies in the AMAZE sample. In each block, the top-left panel shows the best solution (blue cross) and the 1σ confidence level in the AV-metallicity plane. In the other panels the solid black line (best fit) and the dashed lines (dispersion) show the empirical relations between various line ratios and the gas metallicity. The green error bars show the observed ratios (along the y-axis) and the best-fit metallicity with uncertainty (along the x-axis); the blue cross shows the de-reddened ratios from adopting the best-fit extinction; the red line shows the projection of the 1σ uncertainty of the fit in the top-left panel. |
| Open with DEXTER | |
 |
Fig. B.4
Diagnostic tools used to determine the metallicity of the galaxies in the AMAZE sample. In each block, the top-left panel shows the best solution (blue cross) and the 1σ confidence level in the AV-metallicity plane. In the other panels the solid black line (best fit) and the dashed lines (dispersion) show the empirical relations between various line ratios and the gas metallicity. The green error bars show the observed ratios (along the y-axis) and the best-fit metallicity with uncertainty (along the x-axis); the blue cross shows the de-reddened ratios from adopting the best-fit extinction; the red line shows the projection of the 1σ uncertainty of the fit in the top-left panel. |
| Open with DEXTER | |
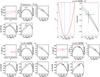 |
Fig. B.5
Diagnostic tools used to determine the metallicity of lensed galaxies in the AMAZE sample. In each block, the top-left panel shows the best solution (blue cross) and the 1σ confidence level in the AV–metallicity plane. In the other panels the solid black line show the average relations between various line ratios and the gas metallicity as inferred by Maiolino et al. (2008). The dashed lines show the associated dispersions. The green error bars show the observed ratios (along the y-axis) and the best-fit metallicity with uncertainty (along the x-axis); the blue cross shows the best-fit metallicity and the de-reddened ratios from adopting the best-fit extinction; the red line shows the projection of the 1σ uncertainty of the fit in the top-left panel. For the lensed AMAZE galaxy LnA1689-2 the metallicity was inferred from the [NeIII]/[OII] line ratio exploiting the anticorrelation (though with high dispersion) between this line ratio and the metallicity found in Maiolino et al. (2008). |
| Open with DEXTER | |
© ESO, 2014
Current usage metrics show cumulative count of Article Views (full-text article views including HTML views, PDF and ePub downloads, according to the available data) and Abstracts Views on Vision4Press platform.
Data correspond to usage on the plateform after 2015. The current usage metrics is available 48-96 hours after online publication and is updated daily on week days.
Initial download of the metrics may take a while.