Fig. B.2
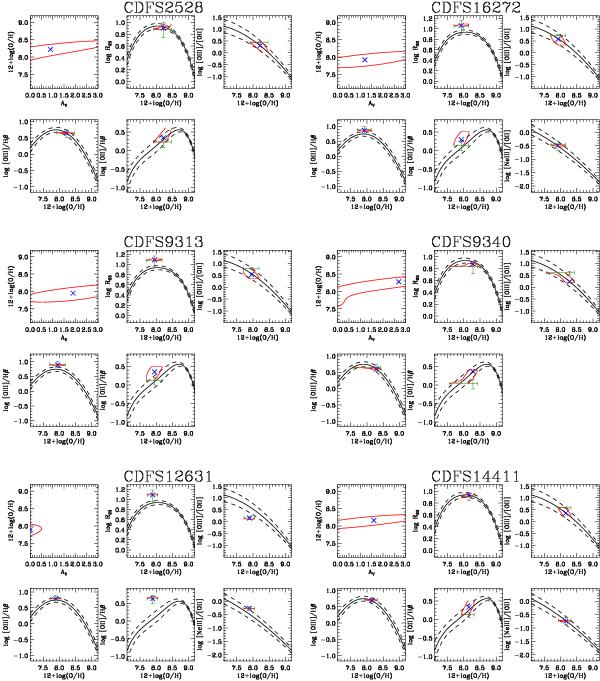
Diagnostic tools used to determine the metallicity of the galaxies in the AMAZE sample. In each block, the top-left panel shows the best solution (blue cross) and the 1σ confidence level in the AV-metallicity plane. In the other panels the solid black line (best fit) and the dashed lines (dispersion) show the empirical relations between various line ratios and the gas metallicity. The green error bars show the observed ratios (along the y-axis) and the best-fit metallicity with uncertainty (along the x-axis); the blue cross shows the de-reddened ratios from adopting the best-fit extinction; the red line shows the projection of the 1σ uncertainty of the fit in the top-left panel.
Current usage metrics show cumulative count of Article Views (full-text article views including HTML views, PDF and ePub downloads, according to the available data) and Abstracts Views on Vision4Press platform.
Data correspond to usage on the plateform after 2015. The current usage metrics is available 48-96 hours after online publication and is updated daily on week days.
Initial download of the metrics may take a while.