| Issue |
A&A
Volume 563, March 2014
|
|
|---|---|---|
| Article Number | A5 | |
| Number of page(s) | 20 | |
| Section | Galactic structure, stellar clusters and populations | |
| DOI | https://doi.org/10.1051/0004-6361/201220956 | |
| Published online | 25 February 2014 | |
Online material
Appendix A: Description of the fit of the RGB
We parametrized the RGB with the function  as given in Saviane et al. (2000). Since the data do not only contain RGB stars, but also the horizontal branch, blue stragglers and foreground stars, we have defined a region to guarantee a high fraction of RGB stars in our fit sample. The extent of this region can be seen as the red frame in Fig. A.1. Note that this region excludes also the red clump.
In some clusters, there is a distinct asymptotic giant branch (AGB) visible, which lies on the blue side of the RGB (it is mostly seen at F814W magnitudes between −1 and −2). As in Saviane et al. (2000), we have removed these AGB stars by excluding all detections that lie blue wards of a reference line with the same slope for all clusters (denoted in Fig. A.1 by a dashed red line). The horizontal position of the reference line was set to be 0.05 mag blue wards (at F814W = −0.5) of a first fit of all stars in the RGB region. The fit including all stars is shown in the CMDs as black dashed line, while the final fit after the AGB removal is shown as black solid line.
For the actual fit we used the python package scipy.odr. This routine performs an orthogonal distance regression, i.e. it minimizes the orthogonal distance between the curve and the data points. The distance of each data point is weighted with its measurement uncertainty. This method is a variation of the typical χ2 minimization, now generalized for data with uncertainties on both variables.
The ACSGCS team reports photometric uncertainties for each individual star, which are typically quite small; the median uncertainty in F814W is only 0.003 mag. This is much smaller than both the observed scatter in the RGB and the errors that are found in the artificial star test at a level of F814W ≈ 0. (There are no artificial star tests at brighter magnitudes.) The mean measurement error estimated from the difference of the input and recovered magnitudes in the artificial star test are 0.06 mag in F814W and 0.03 mag in color. These estimates are added in quadrature to the reported uncertainties of each star. The smaller error in color is due to the fact that errors in both bands are correlated. Thus the uncertainty of the difference of both bands is smaller than the uncertainty in each band.
Finally, we visually inspected each CMD with its fit, to check for any residual problems of our clusters. After this inspection we excluded four more clusters from the sample: NGC 6838 and NGC 6441, because their RGB fits do not reach the MI = −3.5 level; NGC 6388 (and again NGC 6441), because their red clumps seem to be to faint (Bellini et al. 2013, also found problems with differential reddening and multiple populations in these two clusters); and NGC 6715, because it has a clear and strong second RGB.
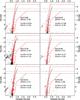 |
Fig. A.1
CMDs of the 53 clusters in our sample, with fitted RGB curves. The two horizontal gray lines indicate the magnitudes at which the colors are measured. The red frame gives the region where stars are used for the fit. The reference line to separate AGB from RGB stars is shown as a red dashed line. The solid black line shows the best-fit RGB function after the rejection of the AGB. Note, that all stars in the CMD are actually drawn with error bars, but for many stars the reported errors are too small to be visible in these plots. |
| Open with DEXTER | |
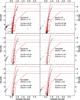 |
Fig. A.1
continued. |
| Open with DEXTER | |
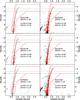 |
Fig. A.1
continued. |
| Open with DEXTER | |
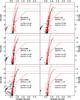 |
Fig. A.1
continued. |
| Open with DEXTER | |
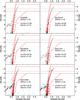 |
Fig. A.1
continued. |
| Open with DEXTER | |
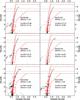 |
Fig. A.1
continued. |
| Open with DEXTER | |
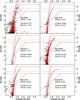 |
Fig. A.1
continued. |
| Open with DEXTER | |
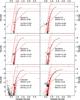 |
Fig. A.1
continued. |
| Open with DEXTER | |
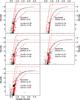 |
Fig. A.1
continued. |
| Open with DEXTER | |
Appendix B: Properties of the globular clusters
The properties of the globular clusters, from the literature and determined in this work, are summarized in Tables B.1 and B.2 respectively.
Literature data for the clusters used in this work.
Results for all clusters used in this work.
© ESO, 2014
Current usage metrics show cumulative count of Article Views (full-text article views including HTML views, PDF and ePub downloads, according to the available data) and Abstracts Views on Vision4Press platform.
Data correspond to usage on the plateform after 2015. The current usage metrics is available 48-96 hours after online publication and is updated daily on week days.
Initial download of the metrics may take a while.