Fig. A.1
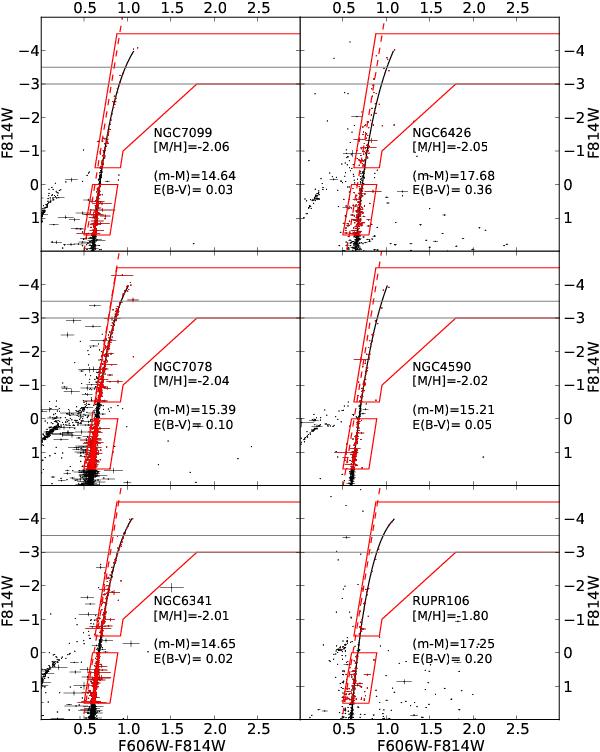
CMDs of the 53 clusters in our sample, with fitted RGB curves. The two horizontal gray lines indicate the magnitudes at which the colors are measured. The red frame gives the region where stars are used for the fit. The reference line to separate AGB from RGB stars is shown as a red dashed line. The solid black line shows the best-fit RGB function after the rejection of the AGB. Note, that all stars in the CMD are actually drawn with error bars, but for many stars the reported errors are too small to be visible in these plots.
Current usage metrics show cumulative count of Article Views (full-text article views including HTML views, PDF and ePub downloads, according to the available data) and Abstracts Views on Vision4Press platform.
Data correspond to usage on the plateform after 2015. The current usage metrics is available 48-96 hours after online publication and is updated daily on week days.
Initial download of the metrics may take a while.