| Issue |
A&A
Volume 562, February 2014
|
|
|---|---|---|
| Article Number | A24 | |
| Number of page(s) | 37 | |
| Section | Galactic structure, stellar clusters and populations | |
| DOI | https://doi.org/10.1051/0004-6361/201322794 | |
| Published online | 03 February 2014 | |
Online material
Appendix A
This appendix presents the spectra of C stars listed in Table 1 of the paper (eight halo C stars, four FBS halo stars, three C stars in Carina, and eight Fornax C stars). The CN and C2 bands dominate these spectra, occasionally with Hα in emission (indicated). The strong absorption feature at 7600 Å is due to telluric O2. The scaling factors f to obtain the ordinates in erg s-1 cm-2 Å-1 is given in Table A.1. The FBS stars have no flux calibration. Note that almost all these stars are subject to variability.
Table A.2 presents the list of objects in the field of Fornax for which EFOSC2 spectroscopy was analysed and which are not C stars. These stars are mostly M-type foreground dwarfs, except for the object 2MASS J024000.78−341812.2, which appears fuzzy along the slit in the spectra and is probably a galaxy.
In Table A.4, the periodic variables found with Catalina and LINEAR data are listed. In the first column, the objects named “SDSS Green #nnn” are taken from Table 1 of Green (2013), where nnn is the object rank in his table. Similarly, the object named 2MASS Gizis #32 comes from Table 1 of Gizis (2002). The names “mxxx” come from the lists in Paper I to IV.
Scaling factors f for spectra shown in this appendix.
Objects in the direction of Fornax that are not carbon stars.
Average 2MASS JHK colours of halo carbon stars.
Halo C stars with periods.
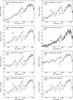 |
Fig. A.1
Spectra of halo carbon stars. |
| Open with DEXTER | |
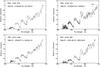 |
Fig. A.2
Spectra of FBS halo carbon stars. |
| Open with DEXTER | |
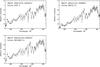 |
Fig. A.3
Spectra of Carina carbon stars. |
| Open with DEXTER | |
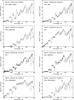 |
Fig. A.4
Spectra of Fornax carbon stars. |
| Open with DEXTER | |
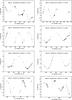 |
Fig. A.5
TAROT light curves of halo carbon stars. |
| Open with DEXTER | |
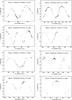 |
Fig. A.5
continued. |
| Open with DEXTER | |
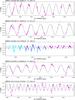 |
Fig. A.6
Atlas of light curves with LINEAR (colored in cyan) and Catalina (in magenta), and fitted sinusoids. |
| Open with DEXTER | |
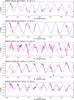 |
Fig. A.6
continued. |
| Open with DEXTER | |
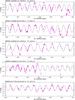 |
Fig. A.6
continued. |
| Open with DEXTER | |
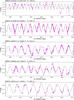 |
Fig. A.6
continued. |
| Open with DEXTER | |
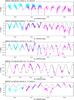 |
Fig. A.6
continued. |
| Open with DEXTER | |
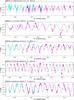 |
Fig. A.6
continued. |
| Open with DEXTER | |
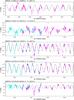 |
Fig. A.6
continued. |
| Open with DEXTER | |
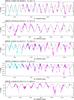 |
Fig. A.6
continued. |
| Open with DEXTER | |
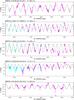 |
Fig. A.6
continued. |
| Open with DEXTER | |
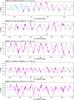 |
Fig. A.6
continued. |
| Open with DEXTER | |
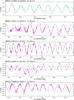 |
Fig. A.6
continued. |
| Open with DEXTER | |
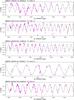 |
Fig. A.6
continued. |
| Open with DEXTER | |
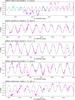 |
Fig. A.6
continued. |
| Open with DEXTER | |
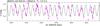 |
Fig. A.6
continued. |
| Open with DEXTER | |
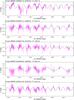 |
Fig. A.7
Light curves of Fornax C stars and fitted sinusoids. |
| Open with DEXTER | |
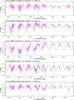 |
Fig. A.7
continued. |
| Open with DEXTER | |
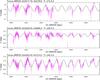 |
Fig. A.7
continued. |
| Open with DEXTER | |
© ESO, 2014
Current usage metrics show cumulative count of Article Views (full-text article views including HTML views, PDF and ePub downloads, according to the available data) and Abstracts Views on Vision4Press platform.
Data correspond to usage on the plateform after 2015. The current usage metrics is available 48-96 hours after online publication and is updated daily on week days.
Initial download of the metrics may take a while.