| Issue |
A&A
Volume 561, January 2014
|
|
|---|---|---|
| Article Number | A33 | |
| Number of page(s) | 30 | |
| Section | Extragalactic astronomy | |
| DOI | https://doi.org/10.1051/0004-6361/201322338 | |
| Published online | 20 December 2013 | |
Online material
Observed parameters of the galaxies.
Derived parameters of the galaxies.
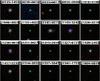 |
Fig. 10
20′′ × 20′′ SDSS composite g,r,i images of galaxies with m(3.4 μm)−m(4.6 μm) ≥ 2 mag. |
| Open with DEXTER | |
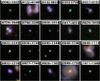 |
Fig. 11
20′′ × 20′′ SDSS composite g,r,i images of galaxies with 2 mag >m(3.4 μm)−m(4.6 μm) ≥ 1.5 mag. |
| Open with DEXTER | |
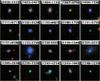 |
Fig. 11
continued. |
| Open with DEXTER | |
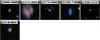 |
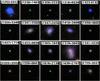
Fig. 11
continued. |
| Open with DEXTER | |
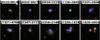 |
Fig. 12
20′′ × 20′′ SDSS composite g,r,i images of ten representative galaxies with m(3.4 μm)−m(4.6 μm) < 0.5 mag. |
| Open with DEXTER | |
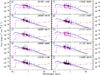 |
Fig. 13
Spectral energy distributions galaxies with m(3.4 μm)−m(4.6 μm) ≥ 2 mag. Observed SDSS optical spectra are shown by black solid lines; observed GALEX, SDSS and WISE monochromatic fluxes are shown by filled red circles. The WISE data are connected by a red solid line. The modelled SED shown by the blue line is a sum of stellar emission (green line) and ionised gas emission (magenta line). |
| Open with DEXTER | |
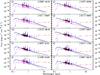 |
Fig. 13
continued. |
| Open with DEXTER | |
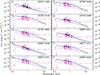 |
Fig. 14
Same as in Fig. 13 but for galaxies with 2 mag >m(3.4 μm)−m(4.6 μm) ≥ 1.5 mag. |
| Open with DEXTER | |
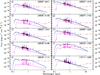 |
Fig. 14
continued. |
| Open with DEXTER | |
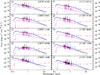 |
Fig. 14
continued. |
| Open with DEXTER | |
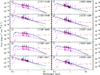 |
Fig. 14
continued. |
| Open with DEXTER | |
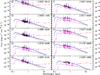 |
Fig. 14
continued. |
| Open with DEXTER | |
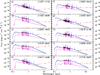 |
Fig. 14
continued. |
| Open with DEXTER | |
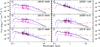 |
Fig. 14
continued. |
| Open with DEXTER | |
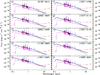 |
Fig. 15
Same as in Fig. 13 but for galaxies with m(3.4 μm)−m(4.6 μm) < 0.5 mag. |
| Open with DEXTER | |
© ESO, 2013
Current usage metrics show cumulative count of Article Views (full-text article views including HTML views, PDF and ePub downloads, according to the available data) and Abstracts Views on Vision4Press platform.
Data correspond to usage on the plateform after 2015. The current usage metrics is available 48-96 hours after online publication and is updated daily on week days.
Initial download of the metrics may take a while.