| Issue |
A&A
Volume 561, January 2014
|
|
|---|---|---|
| Article Number | A86 | |
| Number of page(s) | 22 | |
| Section | Extragalactic astronomy | |
| DOI | https://doi.org/10.1051/0004-6361/201322217 | |
| Published online | 07 January 2014 | |
Online material
Appendix A: Far-infrared SEDs
Figure A.1 presents the FIR properties of some of our galaxies with individual FIR detections. In the first column, galaxies were randomly selected within a sample with 1010.8 < M∗ [M⊙] < 1011 and − 0.1 < Δlog (SSFR)MS < 0.1. In the second column, galaxies were randomly selected within a sample with 1010.8 < M∗ [M⊙] < 1011 and Δlog (SSFR)MS > MAX [Δlog (SSFR)MS] − 0.1. To derive the infrared luminosities and dust temperatures of these galaxies (see Sects. 2.6, 3.1 and Table A.1), we fitted their FIR flux densities with the DH SED template library.
Dust temperatures assigned to the DH SED templates by fitting their simulated z = 0 PACS/SPIRE flux densities with a single modified (i.e., β = 1.5) blackbody function.
Figure A.2 presents the mean FIR properties of some of our SFR− M∗ bins, as inferred from our stacking analysis. In the first column, SFR− M∗ bins were selected to have 1010.8 < M∗ [M⊙] < 1011 and − 0.1 < Δlog (SSFR)MS < 0.1, while in the second column, SFR− M∗ bins were selected to have 1010.8 < M∗ [M⊙] < 1011 and Δlog (SSFR)MS = MAX [Δlog (SSFR)MS]. To derive the mean dust temperature of these SFR–M∗ bins, we fitted their FIR flux densities with the DH SED template library (see Fig. A.2).
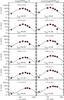 |
Fig. A.1
FIR properties of some of our galaxies with individual FIR detections. All these galaxies have 1010.8 < M∗ [M⊙] < 1011. In the first column, galaxies have − 0.1 < Δlog (SSFR)MS < 0.1 while in the second column they have Δlog (SSFR)MS > MAX [Δlog (SSFR)MS] − 0.1. Black lines show the DH SED templates best-fitting these FIR flux densities. From these fits, we inferred the infrared luminosities and dust temperatures of our galaxies. |
| Open with DEXTER | |
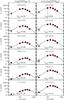 |
Fig. A.2
FIR properties of some of our SFR–M∗ bins, as inferred from our stacking analysis. These SFR–M∗ bins have 1010.8 < M∗ [M⊙] < 1011. In the first column, SFR–M∗ bins have − 0.1 < Δlog (SSFR)MS < 0.1, while in the second column they have Δlog (SSFR)MS = max [Δlog (SSFR)MS]. Black lines show the DH SED templates best-fitting these FIR flux densities. From these fits, we inferred the mean dust temperatures of galaxies in these SFR–M∗ bins. We also verified that the infrared luminosities inferred from these fits agree, within 0.3 dex, with the mean infrared luminosities inferred from our “ladder of SFR indicators” (see Sect. 2.6). |
| Open with DEXTER | |
Appendix B: The Tdust–Δlog (SSFR)MS relation in the GOODS fields
Figure B.1 presents the Tdust − Δlog (SSFR)MS relation, as inferred using the GOODS fields. Because we exclude the COSMOS observations from our stacking analysis, our ability
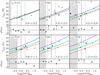 |
Fig. B.1
Dust temperature of galaxies as a function of Δlog (SSFR)MS, as derived from our stacking analysis using only the GOODS fields (i.e., excluding the COSMOS observations). Symbols and lines are the same as in Fig. 8. |
| Open with DEXTER | |
to probe and sample properly the SFR–M∗ parameter space decreases. Therefore, the number of data points available to study the Tdust − Δlog (SSFR)MS relation is significantly reduced. Despite this limitation, we still observe a Tdust − Δlog (SSFR)MS relation evolving with redshift.
Appendix C: The Tdust–Δlog (SSFR)MS relation using different definition of the MS
In this appendix we test the robustness of the Tdust − Δlog (SSFR)MS correlation against changes in the definition of the MS of star formation. Figure C.1 shows
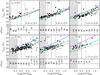 |
Fig. C.1
Dust temperature of galaxies as a function of Δlog (SSFR)MS, as derived from our stacking analysis. In this figure, the definition of the MS of star formation is taken from Elbaz et al. (2011). Symbols and lines are the same as in Fig. 8. |
| Open with DEXTER | |
the Tdust − Δlog (SSFR)MS correlation using the definition of the MS from Elbaz et al. (2011). We still observe a strong correlation between Tdust and Δlog (SSFR)MS as revealed by the high Spearman correlation factor found in all our redshift bins. Our results are thus robust against changes in the definition of the MS.
© ESO, 2014
Current usage metrics show cumulative count of Article Views (full-text article views including HTML views, PDF and ePub downloads, according to the available data) and Abstracts Views on Vision4Press platform.
Data correspond to usage on the plateform after 2015. The current usage metrics is available 48-96 hours after online publication and is updated daily on week days.
Initial download of the metrics may take a while.