| Issue |
A&A
Volume 560, December 2013
|
|
|---|---|---|
| Article Number | A39 | |
| Number of page(s) | 16 | |
| Section | Interstellar and circumstellar matter | |
| DOI | https://doi.org/10.1051/0004-6361/201322400 | |
| Published online | 03 December 2013 | |
Online material
Appendix A: Herschel/HIFI observations
List of the Herschel/HIFI obsIDs.
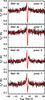 |
Fig. A.1
Comparison of the WBS (red) and HRS (black) spectra obtained at 894 GHz with Herschel/HIFI towards IRAS 4A and IRAS 4B for the H and V polarizations. |
| Open with DEXTER | |
Appendix B: SiO and HDO: The same origin?
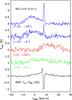 |
Fig. B.1
Comparison of the HDO 11,1–00,0 transition (black) observed towards IRAS 4A and the SiO ν= 0 J = 2–1 line observed towards IRAS 4A (green), a position in the red part of the outflow (red, position (+ 0″, + 20″) with respect to IRAS4A) and two positions in the blue part of the outflow (blue, upper spectra: position (− 12″, − 16″), lower spectra: position (− 12″, − 4″)). The narrow emission line of SiO appears at the same velocity as the thin absorbing layer of HDO. |
| Open with DEXTER | |
The present observations towards the IRAS 4 region reveal an interesting similarity between the deep absorbing components of HDO and the narrow SiO emission line detected by Lefloch et al. (1998). The latter shows a velocity and a linewidth consistent with the HDO absorbing component (see Fig. B.1), which could suggest a common origin. The narrow SiO emission is quite extended (~200″, see Fig. 2 in Lefloch et al. 1998), as we have also inferred for the HDO absorbing layer (see Sect. 3.3). Variations of the narrow SiO line intensity are observed along the NGC 1333 complex, with particularly bright lines around the blue lobe and non-detections towards the source and the red lobe. From LVG (Large Velocity Gradient) modeling of the bright SiO narrow components in the blue lobe, Lefloch et al. (1998) estimated the SiO column density of (1 − 5) × 1012 cm-2 and the H2 density at about (1 − 5) × 105 cm-3, assuming a gas temperature of 33 K equal to that of the dust. For the same SiO column density and a lower H2 density (~104 cm-3), the intensity of the SiO ν= 0 J = 2–1 line is only 0.07 K, in agreement with the non-detection by Lefloch et al. of narrow SiO emission towards our HDO spectra positions (≲0.27 K for both the source position and the red lobe). To reproduce the HDO absorbing components with the RATRAN modeling, it is also necessary to restrain the H2 density at a lower value (<105 cm-3; see Sect. 3.3). A layer of constant column density but subject to density variations (n(H2) < 105 cm-3 towards the sources and the red lobe and n(H2) ~ (1 − 5) × 105 cm-3 towards the blue lobe) could then explain both the deep HDO absorptions and the lack of detectable SiO narrow emission towards the sources and the red lobe as well as the bright SiO narrow emission towards the blue lobe. Alternatively, a layer of uniform low density ~104 cm-3, but with gas temperature locally increasing to ~80–100 K towards the blue lobe, would explain why SiO is only detected in this region. In these cases, the HDO absorptions should be shallower towards the blue part of the outflow. Unfortunately, no HDO observation is available at this position to confirm it. Assuming that the HDO column density of the absorbing layer does not vary significantly between IRAS 4A and the blue outflow lobe, the SiO/HDO abundance ratio in this layer would be ~0.07–0.35. The beam sizes of the HDO 11,1–00,0 line at 894 GHz and the SiO ν= 0 J = 2–1 transition mapped by Lefloch et al. (1998) with the IRAM-30 m telescope are similar.
Another argument suggesting that the narrow HDO and SiO components may trace the same layer is that, in dense and dark clouds, both of these species are believed to be mostly trapped in dust grains and their associated icy mantles. Hence, the same mechanism could release SiO (or other Si components) at the same time as HDO and H2O into the gas phase. We discuss below two mechanisms able to release these molecules into the gas phase: photodesorption and shocks. Another mechanism proposed by Yıldız et al. (2012) to explain detections of narrow 13CO emission lines within the outflow lobes of IRAS 4A is UV-heating by the central source. The narrow SiO emission in NGC 1333 has a more extended spatial distribution, which instead tends to peak outside of the outflow cavities (see Fig. 1 in Lefloch et al. 1998), which appears to rule out this interpretation here.
Appendix B.1: Photodesorption
It was suggested that narrow SiO emission at the systemic velocity could be produced by photodesorption mechanisms in photodissociation regions (PDR) such as the Orion bar (Walmsley et al. 1999; Schilke et al. 2001). Indeed, the strength of Si+ in irradiated regions suggests that up to ~10% of the elemental silicon is not locked in silicate grain cores, but in less refractory material that gets efficiently desorbed at low AV (Haas et al. 1986). We note that a similar fraction of silicon (~5%) with respect to the cosmic abundance (~3 × 10⁻⁵) is measured in the gas-phase of diffuse clouds (e.g., Morton 1975; Sofia et al. 1994; Miller et al. 2007). Gusdorf et al. (2008b) also estimated that, to account for the observed SiO line intensities in the blue lobe of L1157, about ~10% of the silicon assumed in the form of SiO has to be locked in the grain mantles.
Photodesorption could then release SiO in the gas phase simultaneously with water and HDO. Alternatively, the material could be trapped in grain mantles in the form of atomic Si; the Si would then be desorbed and react with O2 or OH to form SiO according to the following reactions (Walmsley et al. 1999):  The balance between photodesorption and photodissociation predicts an SiO-enriched layer located at some depth behind the photodissociation front, which can easily explain the SiO column density observed towards the Orion Bar of a few 1012 cm-2 (Walmsley et al. 1999; Schilke et al. 2001). Although O2 is actually less abundant than assumed in these early models, a tentative detection of O2 was recently reported towards IRAS 4A at a velocity (~8.0 km s-1) close to our HDO absorptions (~7.6 km s-1), and suggested to be produced by photodesorption mechanisms (Yıldız et al. 2013). Photodissociation of H2O would also produce ample OH to react with Si and form SiO by the second reaction above.
Photodesorption of grain mantles thus appears as a possible explanation for the narrow HDO and SiO components at the systemic velocity towards the IRAS 4A region. Photodissociation region models appropriate for the surface of the NGC 1333 cloud, i.e., with lower UV radiation field (χ ~ 1) than the Orion bar (χ ~ 104–105), could verify if this mechanism also reproduces the observed SiO/HDO ratio.
Appendix B.2: Shocks
Shocks are another non-thermal mechanism able to remove both silicon and water from dust grains. Contrary to CO that traces all of the entrained material in molecular flows, broad SiO emission is mostly detected in the youngest outflows from Class 0 protostars (Gibb et al. 2004). This is not surprising, as SiO requires a higher density than CO for excitation and especially shocks fast enough (≥10 − 25 km s-1) to efficiently sputter SiO and Si from the mantles and grain cores in which they would otherwise remain locked (Schilke et al. 1997; Caselli et al. 1997; Gusdorf et al. 2008a,b; Guillet et al. 2009). Sputtering processes also efficiently release water ice from grain mantles, as illustrated, for example, by the similarity of the SiO and H2O high-velocity wings in the L1157 outflow (Lefloch et al. 2010), and the broad wings in the HDO profile towards IRAS 4A (see Fig. B.1). The IRAS 4A outflow wings have a total SiO column density of a few 1013 cm-2 and an abundance relative to CO ~ 3 × 10⁻⁴ (Lefloch et al. 1998), typical of young outflows (Tafalla et al. 2010). The narrow SiO component towards IRAS 4A has a column density that is 10 times smaller than the column density in the broad SiO component, and an abundance relative to CO that is 100 times lower, when compared to the total C18O at systemic velocity (Lefloch et al. 1998). Hence, the presence of the narrow SiO and HDO components could be explained in this context if about 10% of the SiO (and HDO) released in outflow shocks suffered strong deceleration and chemical dilution (by a typical factor of 10–100) due to turbulent mixing with static ambient gas (Lefloch et al. 1998; Codella et al. 1999). The surface dilution induced by the mixing process would be compensated by the contribution of neighboring outflows, which cover a large fraction of the surface area in NGC 1333. The SiO/HDO ratio is estimated in the outflows at 0.25–1.5 (using N(SiO) = 1–3 × 1013 cm-2 from Lefloch et al. 1998 and N(HDO) = 2–4 × 1013 cm-2 from Sect. 3.4). This could be consistent with that estimated for the narrow layer (0.07–0.35), raising the possibility that shocked gas could contribute to this extended SiO/HDO layer. The SiO and HDO molecules will then re-deplete onto grain mantles on timescales depending on the volume densities (~104 years for densities about 105 cm-3 and ~105 years for densities about 104 cm-3). Numerical simulations would be helpful to compare the predicted SiO/HDO ratio with the observations as well as to verify that sufficient deceleration can indeed be reached before SiO and HDO are readsorbed onto the grains to produce narrow SiO and HDO features close to systemic velocity.
Interactions of magnetic and/or radiative shock precursors with the ambient pre-shocked clumpy medium were also mentioned as a potential mechanism leading to the emission of narrow SiO lines (Jiménez-Serra et al. 2004, 2010, 2011). This interpretation was supported by the higher degree of excitation of the ion fluid compared to the neutral fluid towards the protostar L1448-mm. Roberts et al. (2012) showed, however, that the higher excitation of H13CO+ in the narrow component is not a conclusive indication of a precursor (it could simply be due to protostellar heating). This interpretation then relies entirely on the fact that the narrow SiO emission is compact and spatially confined to the regions around protostars. In the NGC 1333 complex, the narrow SiO component is spatially extended over the whole region (Lefloch et al. 1998). Therefore, the shock precursor interpretation would not hold here.
© ESO, 2013
Current usage metrics show cumulative count of Article Views (full-text article views including HTML views, PDF and ePub downloads, according to the available data) and Abstracts Views on Vision4Press platform.
Data correspond to usage on the plateform after 2015. The current usage metrics is available 48-96 hours after online publication and is updated daily on week days.
Initial download of the metrics may take a while.