| Issue |
A&A
Volume 560, December 2013
|
|
|---|---|---|
| Article Number | A66 | |
| Number of page(s) | 17 | |
| Section | Cosmology (including clusters of galaxies) | |
| DOI | https://doi.org/10.1051/0004-6361/201322104 | |
| Published online | 06 December 2013 | |
Online material
Appendix A: Relation between the Hα bias and the mass step
In this Appendix we provide the mathematical details needed to understand the relation between the ΣHα group magnitudes and the observed mass step. This derivation provides the relation between the numerical values of the Hα bias and the mass step in the SNfactory dataset.
To begin with, the dataset is partioned into four subsets consisting of SNe
Iaα and SNe Iaϵ above and below the canonical mass
division point of
log (M/M⊙) = 10. We
denote the number in each subset as Nα,L,
Nα,H,
Nϵ,L, and
Nϵ,H, with L and H symbolizing SNe Ia
in low- and high-mass hosts, respectively. Likewise, the mean Hubble residuals for each
subset are denoted as  ,
,
 ,
,
 , and
, and
 .
.
To make the equations more readable we introduce the following notation for fractions:
 means “the
fraction of SNe from subset A that have property B”.
For instance,
means “the
fraction of SNe from subset A that have property B”.
For instance,  means
“the fraction of SNe Ia from high-mass hosts that are Iaϵ”, i.e.,
Nϵ,H/NH.
Mathematically, B is the numerator and A the
denominator. Naturally, the partitioning imposes the requirement that
means
“the fraction of SNe Ia from high-mass hosts that are Iaϵ”, i.e.,
Nϵ,H/NH.
Mathematically, B is the numerator and A the
denominator. Naturally, the partitioning imposes the requirement that
 ,
e.g.,
,
e.g.,  .
.
Appendix A.1: General equations
The Hα bias,  , is defined as the
weighted mean difference of the
, is defined as the
weighted mean difference of the  between the Iaϵ and Iaα subsamples:
  (A.1)The mass step,
 , is
defined as the weighted mean difference of the
between SNe Ia in low-mass and the high-mass hosts:
, is
defined as the weighted mean difference of the
between SNe Ia in low-mass and the high-mass hosts:  (A.2)The individual
weighted mean magnitudes entering Eqs. (A.1) and (A.2) can be written
in terms of the weighted mean magnitudes for each portion. Introduction of our
notation
then gives
(A.2)The individual
weighted mean magnitudes entering Eqs. (A.1) and (A.2) can be written
in terms of the weighted mean magnitudes for each portion. Introduction of our
notation
then gives 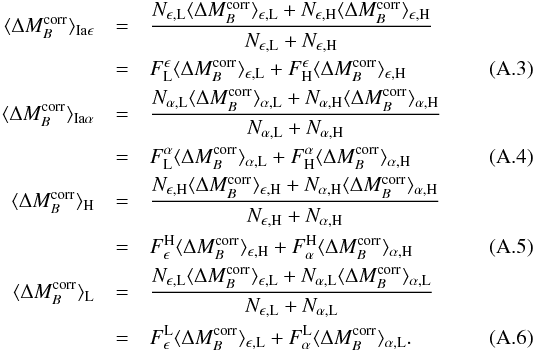 Combining
these we obtain the equations for the Hα bias and mass step in terms
of the partitioned data:
Combining
these we obtain the equations for the Hα bias and mass step in terms
of the partitioned data: 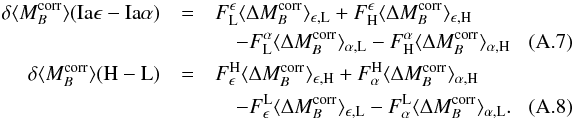 With
this development it is now possible to write the mass step directly in terms of the
Hα bias, as follows:
With
this development it is now possible to write the mass step directly in terms of the
Hα bias, as follows: 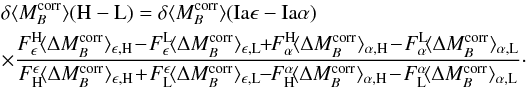 (A.9)In
this expression we have simply rearranged terms to demonstrate that the same weighted
mean magnitudes, just having different signs and fractions, appear in both the
numerator and denominator.
(A.9)In
this expression we have simply rearranged terms to demonstrate that the same weighted
mean magnitudes, just having different signs and fractions, appear in both the
numerator and denominator.
Appendix A.2: Observational constraints
Equation (A.9) is exact when all of
the quantities can be directly measured, as they are in our dataset. These variables
can be generalized to any similar dataset. In order to be exact, though, observations
of the local environment would be required. However, in the main text we presented two
observational constraints that can be used to greatly simply Eq. (A.9). First, we have shown in Sect. 5.2.2 that the averaged
of SNe
Iaα does not depend on the masses of their hosts:  (A.10)Second, we observed
in Fig. 10 that SNe Iaα and
Iaϵ from low-mass hosts share the same mean magnitude (within error
bars):
(A.10)Second, we observed
in Fig. 10 that SNe Iaα and
Iaϵ from low-mass hosts share the same mean magnitude (within error
bars):  (A.11)As a consequence of
these two observations, the righthand side of Eq. (A.7) becomes
(A.11)As a consequence of
these two observations, the righthand side of Eq. (A.7) becomes 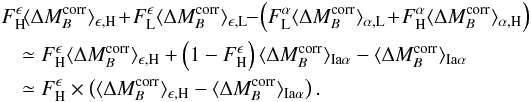 (A.12)Similarly,
the righthand side of Eq. (A.8)
becomes
(A.12)Similarly,
the righthand side of Eq. (A.8)
becomes 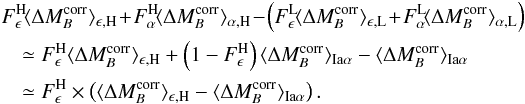 (A.13)Finally,
using the relation
(A.13)Finally,
using the relation  , where
Fϵ is the fraction of SNe
Iaϵ, and FH the fraction of SNe Ia from
high-mass hosts, Eq. (A.9) can simply
be expressed as
, where
Fϵ is the fraction of SNe
Iaϵ, and FH the fraction of SNe Ia from
high-mass hosts, Eq. (A.9) can simply
be expressed as 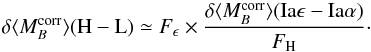 (A.14)In the main
text, the dependence of Fϵ with redshift
is denoted ψ(z), and
is assumed to be
constant. Furthermore, based on the dataset we compiled in Childress et al. (2013a), FH appears to
be constant within 10% up to z ~ 1. Subject to these approximations,
we conclude that the mass-step evolution is simply proportional to
ψ(z), as given in Eq. (6).
(A.14)In the main
text, the dependence of Fϵ with redshift
is denoted ψ(z), and
is assumed to be
constant. Furthermore, based on the dataset we compiled in Childress et al. (2013a), FH appears to
be constant within 10% up to z ~ 1. Subject to these approximations,
we conclude that the mass-step evolution is simply proportional to
ψ(z), as given in Eq. (6).
© ESO, 2013
Current usage metrics show cumulative count of Article Views (full-text article views including HTML views, PDF and ePub downloads, according to the available data) and Abstracts Views on Vision4Press platform.
Data correspond to usage on the plateform after 2015. The current usage metrics is available 48-96 hours after online publication and is updated daily on week days.
Initial download of the metrics may take a while.