| Issue |
A&A
Volume 560, December 2013
|
|
|---|---|---|
| Article Number | A4 | |
| Number of page(s) | 19 | |
| Section | Stellar structure and evolution | |
| DOI | https://doi.org/10.1051/0004-6361/201321970 | |
| Published online | 28 November 2013 | |
Online material
Appendix A: Differential rotation beyond α = 0.3
In Eq. (4) an upper limit of αmax = 0.30 was used while searching for a second period. In this section we demonstrate how different upper limits αmax change the total number of detections and the overall behavior of α with temperature and rotation period. We use ten equidistant values 0.05 ≤ αmax ≤ 0.50 (see Table A.1). With increasing αmax we found a larger total number
Number of stars with second period found for different αmax values.
of periods. The case αmax = 0.5 is shown to demonstrate the limits of our method, which is evident in the next two figures. For all stars with two detected periods we plotted their density in the Teff − α plane in Fig. A.1. The colors are the same as in Fig. 9 with bright regions representing high density. For each αmax value we found that α slightly increases towards cooler stars. The case with the lowest upper limit (αmax = 0.05) looks a bit scattered, but it is not very different from the general trend. The plot in the lower-right corner (αmax = 0.5) demonstrates the limits of our method. Many stars jumped to the upper limit α = 0.5 because an alias period was chosen by the algorithm. The Teff values from the KIC are not very accurate and neither are the stellar radii. We found the same trend with respect to α however, i.e., the α value increases towards smaller radii (although this may not be an independent constraint).
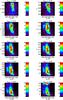 |
Fig. A.1
Density plot in the Teff − α plane for different values of αmax. For each αmax value we found that α slightly increases towards cooler stars. The plot in the lower-right corner (αmax = 0.5) demonstrates that our method is limited to αmax < 0.5. Colors are the same as in Fig. 9. |
| Open with DEXTER | |
Our previous result that α increases towards longer rotation periods holds for all αmax values. In Fig. A.2 we showed the density in the Pmin − α plane. We see that the density is localized in a sharp strip that smears out for limits greater than αmax = 0.3. These large α values belong to periods P2 longer than 45 days where instrumental effects play a dominant role. Again, the stars jumped to the upper limit in the αmax = 0.5 case.
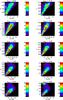 |
Fig. A.2
Density plot in the Pmin − α plane for different values of αmax. For each αmax value we found that α strongly increases with rotation period. The plot in the lower-right corner (αmax = 0.5) demonstrates that our method is limited to αmax < 0.5. Colors are the same as in Fig. 9. |
| Open with DEXTER | |
© ESO, 2013
Current usage metrics show cumulative count of Article Views (full-text article views including HTML views, PDF and ePub downloads, according to the available data) and Abstracts Views on Vision4Press platform.
Data correspond to usage on the plateform after 2015. The current usage metrics is available 48-96 hours after online publication and is updated daily on week days.
Initial download of the metrics may take a while.