| Issue |
A&A
Volume 559, November 2013
|
|
|---|---|---|
| Article Number | A47 | |
| Number of page(s) | 187 | |
| Section | Interstellar and circumstellar matter | |
| DOI | https://doi.org/10.1051/0004-6361/201321096 | |
| Published online | 08 November 2013 | |
Online material
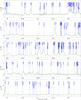 |
Fig. 2
Spectrum obtained toward Sgr B2(N) in the 3 mm window with the IRAM 30 m telescope in main-beam temperature scale. The synthetic model is overlaid in green and its relevant lines are labeled in blue. The frequencies of the hydrogen recombination lines are indicated with a pink label. The position of the lines with a peak temperature higher than 2 K in the image band and possibly contaminating the spectrum are marked with a red label indicating their rest frequency and their peak temperature in K in the image band. |
| Open with DEXTER | |
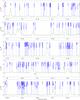 |
Fig. 2
continued. |
| Open with DEXTER | |
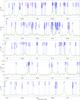 |
Fig. 2
continued. |
| Open with DEXTER | |
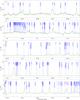 |
Fig. 2
continued. |
| Open with DEXTER | |
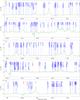 |
Fig. 2
continued. |
| Open with DEXTER | |
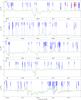 |
Fig. 2
continued. |
| Open with DEXTER | |
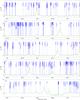 |
Fig. 2
continued. |
| Open with DEXTER | |
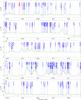 |
Fig. 2
continued. |
| Open with DEXTER | |
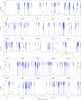 |
Fig. 2
continued. |
| Open with DEXTER | |
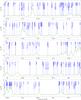 |
Fig. 2
continued. |
| Open with DEXTER | |
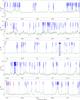 |
Fig. 2
continued. |
| Open with DEXTER | |
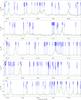 |
Fig. 2
continued. |
| Open with DEXTER | |
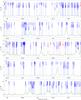 |
Fig. 2
continued. |
| Open with DEXTER | |
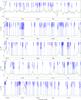 |
Fig. 2
continued. |
| Open with DEXTER | |
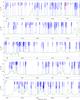 |
Fig. 2
continued. |
| Open with DEXTER | |
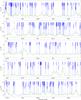 |
Fig. 2
continued. |
| Open with DEXTER | |
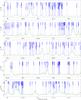 |
Fig. 2
continued. |
| Open with DEXTER | |
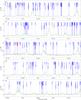 |
Fig. 2
continued. |
| Open with DEXTER | |
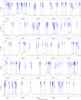 |
Fig. 2
continued. |
| Open with DEXTER | |
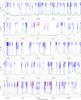 |
Fig. 2
continued. |
| Open with DEXTER | |
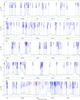 |
Fig. 2
continued. |
| Open with DEXTER | |
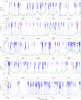 |
Fig. 2
continued. |
| Open with DEXTER | |
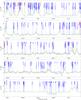 |
Fig. 2
continued. |
| Open with DEXTER | |
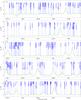 |
Fig. 2
continued. |
| Open with DEXTER | |
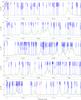 |
Fig. 2
continued. |
| Open with DEXTER | |
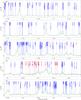 |
Fig. 2
continued. |
| Open with DEXTER | |
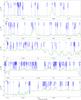 |
Fig. 2
continued. |
| Open with DEXTER | |
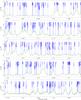 |
Fig. 2
continued. |
| Open with DEXTER | |
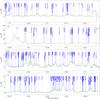 |
Fig. 2
continued. |
| Open with DEXTER | |
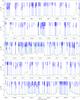 |
Fig. 3
Spectrum obtained toward Sgr B2(N) in the 2 mm window with the IRAM 30 m telescope in main-beam temperature scale. The synthetic model is overlaid in green and its relevant lines are labeled in blue. The frequencies of the hydrogen recombination lines are indicated with a pink label. |
| Open with DEXTER | |
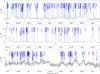 |
Fig. 3
continued. |
| Open with DEXTER | |
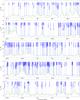 |
Fig. 4
Spectrum obtained toward Sgr B2(N) in the 1 mm window with the IRAM 30 m telescope in main-beam temperature scale. The synthetic model is overlaid in green and its relevant lines are labeled in blue. The frequencies of the hydrogen recombination lines are indicated with a pink label. |
| Open with DEXTER | |
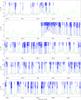 |
Fig. 4
continued. |
| Open with DEXTER | |
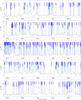 |
Fig. 4
continued. |
| Open with DEXTER | |
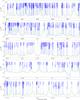 |
Fig. 4
continued. |
| Open with DEXTER | |
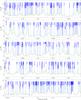 |
Fig. 4
continued. |
| Open with DEXTER | |
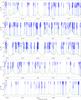 |
Fig. 4
continued. |
| Open with DEXTER | |
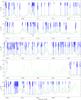 |
Fig. 4
continued. |
| Open with DEXTER | |
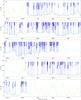 |
Fig. 4
continued. |
| Open with DEXTER | |
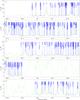 |
Fig. 4
continued. |
| Open with DEXTER | |
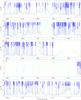 |
Fig. 4
continued. |
| Open with DEXTER | |
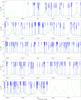 |
Fig. 4
continued. |
| Open with DEXTER | |
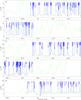 |
Fig. 4
continued. |
| Open with DEXTER | |
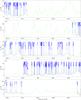 |
Fig. 4
continued. |
| Open with DEXTER | |
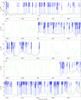 |
Fig. 4
continued. |
| Open with DEXTER | |
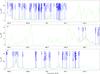 |
Fig. 4
continued. |
| Open with DEXTER | |
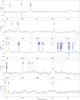 |
Fig. 5
Spectrum obtained toward Sgr B2(M) in the 3 mm window with the IRAM 30 m telescope in main-beam temperature scale. The synthetic model is overlaid in green and its relevant lines are labeled in blue. The frequencies of the hydrogen and helium recombination lines are indicated with a pink label. The position of the lines with a peak temperature higher than 2 K in the image band and possibly contaminating the spectrum are marked with a red label indicating their rest frequency and their peak temperature in K in the image band. |
| Open with DEXTER | |
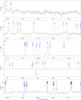 |
Fig. 5
continued. |
| Open with DEXTER | |
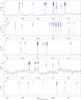 |
Fig. 5
continued. |
| Open with DEXTER | |
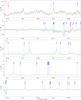 |
Fig. 5
continued. |
| Open with DEXTER | |
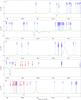 |
Fig. 5
continued. |
| Open with DEXTER | |
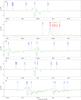 |
Fig. 5
continued. |
| Open with DEXTER | |
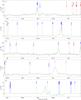 |
Fig. 5
continued. |
| Open with DEXTER | |
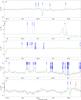 |
Fig. 5
continued. |
| Open with DEXTER | |
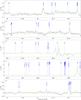 |
Fig. 5
continued. |
| Open with DEXTER | |
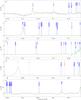 |
Fig. 5
continued. |
| Open with DEXTER | |
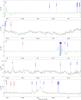 |
Fig. 5
continued. |
| Open with DEXTER | |
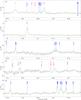 |
Fig. 5
continued. |
| Open with DEXTER | |
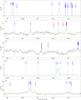 |
Fig. 5
continued. |
| Open with DEXTER | |
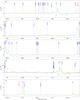 |
Fig. 5
continued. |
| Open with DEXTER | |
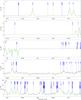 |
Fig. 5
continued. |
| Open with DEXTER | |
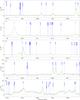 |
Fig. 5
continued. |
| Open with DEXTER | |
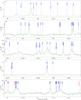 |
Fig. 5
continued. |
| Open with DEXTER | |
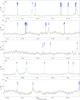 |
Fig. 5
continued. |
| Open with DEXTER | |
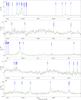 |
Fig. 5
continued. |
| Open with DEXTER | |
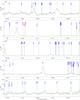 |
Fig. 5
continued. |
| Open with DEXTER | |
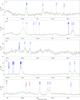 |
Fig. 5
continued. |
| Open with DEXTER | |
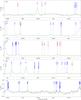 |
Fig. 5
continued. |
| Open with DEXTER | |
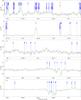 |
Fig. 5
continued. |
| Open with DEXTER | |
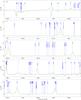 |
Fig. 5
continued. |
| Open with DEXTER | |
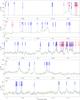 |
Fig. 5
continued. |
| Open with DEXTER | |
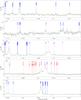 |
Fig. 5
continued. |
| Open with DEXTER | |
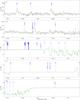 |
Fig. 5
continued. |
| Open with DEXTER | |
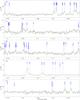 |
Fig. 5
continued. |
| Open with DEXTER | |
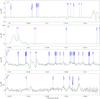 |
Fig. 5
continued. |
| Open with DEXTER | |
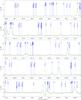 |
Fig. 6
Spectrum obtained toward Sgr B2(M) in the 2 mm window with the IRAM 30 m telescope in main-beam temperature scale. The synthetic model is overlaid in green and its relevant lines are labeled in blue. The frequencies of the hydrogen and helium recombination lines are indicated with a pink label. |
| Open with DEXTER | |
 |
Fig. 6
continued. |
| Open with DEXTER | |
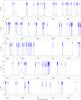 |
Fig. 7
Spectrum obtained toward Sgr B2(M) in the 1 mm window with the IRAM 30 m telescope in main-beam temperature scale. The synthetic model is overlaid in green and its relevant lines are labeled in blue. The frequencies of the hydrogen and helium recombination lines are indicated with a pink label. |
| Open with DEXTER | |
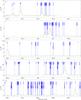 |
Fig. 7
continued. |
| Open with DEXTER | |
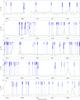 |
Fig. 7
continued. |
| Open with DEXTER | |
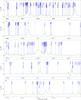 |
Fig. 7
continued. |
| Open with DEXTER | |
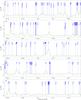 |
Fig. 7
continued. |
| Open with DEXTER | |
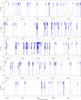 |
Fig. 7
continued. |
| Open with DEXTER | |
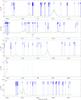 |
Fig. 7
continued. |
| Open with DEXTER | |
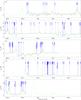 |
Fig. 7
continued. |
| Open with DEXTER | |
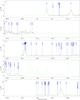 |
Fig. 7
continued. |
| Open with DEXTER | |
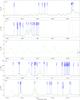 |
Fig. 7
continued. |
| Open with DEXTER | |
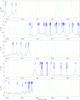 |
Fig. 7
continued. |
| Open with DEXTER | |
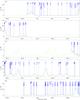 |
Fig. 7
continued. |
| Open with DEXTER | |
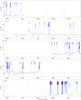 |
Fig. 7
continued. |
| Open with DEXTER | |
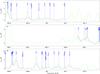 |
Fig. 7
continued. |
| Open with DEXTER | |
Parameters of our best-fit model of C2H3CN toward Sgr B2(N).
Parameters of our best-fit model of C2H5CN toward Sgr B2(N).
Parameters of our best-fit model of C2H5OCHO toward Sgr B2(N).
Parameters of our best-fit model of C2H5OH toward Sgr B2(N).
Parameters of our best-fit model of n-C3H7CN toward Sgr B2(N).
Parameters of our best-fit model of c-C2H4O toward Sgr B2(N).
Parameters of our best-fit model of c-C3H2 toward Sgr B2(N).
Parameters of our best-fit model of CCH toward Sgr B2(N).
Parameters of our best-fit model of CCS toward Sgr B2(N).
Parameters of our best-fit model of CH2NH toward Sgr B2(N).
Parameters of our best-fit model of aGg′-(CH2OH)2 toward Sgr B2(N).
Parameters of our best-fit model of CH2(OH)CHO toward Sgr B2(N).
Parameters of our best-fit model of CH3C3N toward Sgr B2(N).
Parameters of our best-fit model of CH3CCH toward Sgr B2(N).
Parameters of our best-fit model of CH3C(O)CH3 toward Sgr B2(N).
Parameters of our best-fit model of CH3CHO toward Sgr B2(N).
Parameters of our best-fit model of CH3CN toward Sgr B2(N).
Parameters of our best-fit model of CH3C(O)NH2-A toward Sgr B2(N).
Parameters of our best-fit model of CH3COOH toward Sgr B2(N).
Parameters of our best-fit model of CH3NH2 toward Sgr B2(N).
Parameters of our best-fit model of CH3OCH3 toward Sgr B2(N).
Parameters of our best-fit model of CH3OCHO toward Sgr B2(N).
Parameters of our best-fit model of CH3OH toward Sgr B2(N).
Parameters of our best-fit model of CH3SH toward Sgr B2(N).
Parameters of our best-fit model of CN toward Sgr B2(N).
Parameters of our best-fit model of CO toward Sgr B2(N).
Parameters of our best-fit model of CS toward Sgr B2(N).
Parameters of our best-fit model of CH2CO toward Sgr B2(N).
Parameters of our best-fit model of H2CO toward Sgr B2(N).
Parameters of our best-fit model of H2CS toward Sgr B2(N).
Parameters of our best-fit model of NH2CH2CN toward Sgr B2(N).
Parameters of our best-fit model of H2S toward Sgr B2(N).
Parameters of our best-fit model of HC3N toward Sgr B2(N).
Parameters of our best-fit model of HCCNC toward Sgr B2(N).
Parameters of our best-fit model of HCN toward Sgr B2(N).
Parameters of our best-fit model of NH2CHO toward Sgr B2(N).
Parameters of our best-fit model of HCO+ toward Sgr B2(N).
Parameters of our best-fit model of HCS+ toward Sgr B2(N).
Parameters of our best-fit model of HDO toward Sgr B2(N).
Parameters of our best-fit model of HNC toward Sgr B2(N).
Parameters of our best-fit model of HNCO toward Sgr B2(N).
Parameters of our best-fit model of HNCS toward Sgr B2(N).
Parameters of our best-fit model of HOCN toward Sgr B2(N).
Parameters of our best-fit model of HOCO+ toward Sgr B2(N).
Parameters of our best-fit model of HOC+ toward Sgr B2(N).
Parameters of our best-fit model of HSCN toward Sgr B2(N).
Parameters of our best-fit model of N2H+ toward Sgr B2(N).
Parameters of our best-fit model of NH2CN toward Sgr B2(N).
Parameters of our best-fit model of NH2D toward Sgr B2(N).
Parameters of our best-fit model of NS toward Sgr B2(N).
Parameters of our best-fit model of OCS toward Sgr B2(N).
Parameters of our best-fit model of PN toward Sgr B2(N).
Parameters of our best-fit model of SiO toward Sgr B2(N).
Parameters of our best-fit model of SO2 toward Sgr B2(N).
Parameters of our best-fit model of SO toward Sgr B2(N).
Parameters of our best-fit model of t-HCOOH toward Sgr B2(N).
Parameters of our best-fit model of C2H3CN toward Sgr B2(M).
Parameters of our best-fit model of C2H5CN toward Sgr B2(M).
Parameters of our best-fit model of C2H5OH toward Sgr B2(M).
Parameters of our best-fit model of c-C3H2 toward Sgr B2(M).
Parameters of our best-fit model of CCH toward Sgr B2(M).
Parameters of our best-fit model of CCS toward Sgr B2(M).
Parameters of our best-fit model of CH2NH toward Sgr B2(M).
Parameters of our best-fit model of CH3C3N toward Sgr B2(M).
Parameters of our best-fit model of CH3CCH toward Sgr B2(M).
Parameters of our best-fit model of CH3C(O)CH3 toward Sgr B2(M).
Parameters of our best-fit model of CH3CHO toward Sgr B2(M).
Parameters of our best-fit model of CH3CN toward Sgr B2(M).
Parameters of our best-fit model of CH3NH2 toward Sgr B2(M).
Parameters of our best-fit model of CH3OCH3 toward Sgr B2(M).
Parameters of our best-fit model of CH3OCHO toward Sgr B2(M).
Parameters of our best-fit model of CH3OH toward Sgr B2(M).
Parameters of our best-fit model of CH3SH toward Sgr B2(M).
Parameters of our best-fit model of CN toward Sgr B2(M).
Parameters of our best-fit model of CO toward Sgr B2(M).
Parameters of our best-fit model of CS toward Sgr B2(M).
Parameters of our best-fit model of CH2CO toward Sgr B2(M).
Parameters of our best-fit model of H2CO toward Sgr B2(M).
Parameters of our best-fit model of H2CS toward Sgr B2(M).
Parameters of our best-fit model of H2S toward Sgr B2(M).
Parameters of our best-fit model of HC3N toward Sgr B2(M).
Parameters of our best-fit model of HC5N toward Sgr B2(M).
Parameters of our best-fit model of HCN toward Sgr B2(M).
Parameters of our best-fit model of NH2CHO toward Sgr B2(M).
Parameters of our best-fit model of HCO+ toward Sgr B2(M).
Parameters of our best-fit model of HCS+ toward Sgr B2(M).
Parameters of our best-fit model of HDO toward Sgr B2(M).
Parameters of our best-fit model of HNC toward Sgr B2(M).
Parameters of our best-fit model of HNCO toward Sgr B2(M).
Parameters of our best-fit model of HNCS toward Sgr B2(M).
Parameters of our best-fit model of HOCN toward Sgr B2(M).
Parameters of our best-fit model of HOCO+ toward Sgr B2(M).
Parameters of our best-fit model of HOC+ toward Sgr B2(M).
Parameters of our best-fit model of HSCN toward Sgr B2(M).
Parameters of our best-fit model of N2H+ toward Sgr B2(M).
Parameters of our best-fit model of NH2CN toward Sgr B2(M).
Parameters of our best-fit model of NS toward Sgr B2(M).
Parameters of our best-fit model of OCS toward Sgr B2(M).
Parameters of our best-fit model of PN toward Sgr B2(M).
Parameters of our best-fit model of SiO toward Sgr B2(M).
Parameters of our best-fit model of SO2 toward Sgr B2(M).
Parameters of our best-fit model of SO toward Sgr B2(M).
© ESO, 2013
Current usage metrics show cumulative count of Article Views (full-text article views including HTML views, PDF and ePub downloads, according to the available data) and Abstracts Views on Vision4Press platform.
Data correspond to usage on the plateform after 2015. The current usage metrics is available 48-96 hours after online publication and is updated daily on week days.
Initial download of the metrics may take a while.