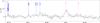
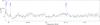
Fig. 5
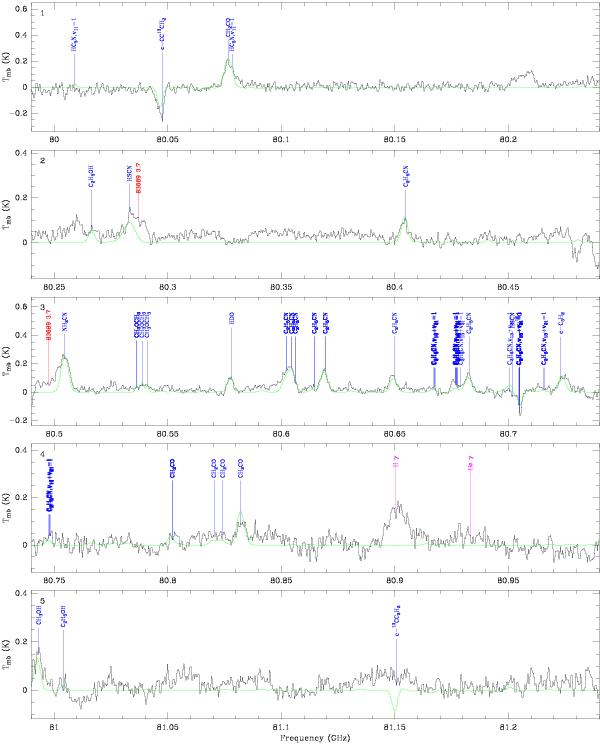
Spectrum obtained toward Sgr B2(M) in the 3 mm window with the IRAM 30 m telescope in main-beam temperature scale. The synthetic model is overlaid in green and its relevant lines are labeled in blue. The frequencies of the hydrogen and helium recombination lines are indicated with a pink label. The position of the lines with a peak temperature higher than 2 K in the image band and possibly contaminating the spectrum are marked with a red label indicating their rest frequency and their peak temperature in K in the image band.
Current usage metrics show cumulative count of Article Views (full-text article views including HTML views, PDF and ePub downloads, according to the available data) and Abstracts Views on Vision4Press platform.
Data correspond to usage on the plateform after 2015. The current usage metrics is available 48-96 hours after online publication and is updated daily on week days.
Initial download of the metrics may take a while.