| Issue |
A&A
Volume 558, October 2013
|
|
|---|---|---|
| Article Number | A134 | |
| Number of page(s) | 30 | |
| Section | Galactic structure, stellar clusters and populations | |
| DOI | https://doi.org/10.1051/0004-6361/201321824 | |
| Published online | 21 October 2013 | |
Online material
Appendix A: Stellar calibrations
Appendix A.1: O-type star calibrations
Appendix A.1.1: O-type star temperatures
Martins et al. (2005, hereafter MSH05) provided a Teff-SpT scale for Galactic O-type stars. Following Mokiem et al. (2007a), a small upward adjustment to the scale was necessary before applying it to our stars in 30 Dor. Furthermore, as MSH05 relied on He i-ii lines, its accuracy could only be maintained as early as O3 type stars, meaning that the scale needed to be extended for earlier type stars in the census.
We turned to the recent work of Rivero González et al. (2012a,b) in order to determine a refined calibration for the Teff of LMC O-type stars. Figure 12 from Rivero González et al. (2012b) compares the Teff of their models against the calibrations of MSH05, showing a typical offset of ≈1 kK for dwarfs, O4 type and later. Only limited models are available of LMC giants and even fewer for supergiants. However, given their minimal offsets from the MSH05 calibration, it was assigned to all our giants and supergiants, O4 type and later. In the case of O2-O3.5 type stars, where possible, Teff was based on averages of the Rivero González et al. (2012b), Doran & Crowther (2011) and Massey et al. (2004, 2005) models, with a double weighting going toward Rivero González et al. (2012b). Extrapolations were made from the MSH05 calibrations in the case of unmodelled SpTs.
Appendix A.1.2: O-type star intrinsic colours and bolometric borrections
Intrinsic colours were adopted from Table 2.1 of Conti et al. (2008). In the case of earlier giants and supergiants, where colours were lacking, a (B − V)o-SpT relation was assumed consistent with the models of Martins & Plez (2006).
MSH05 provide a Teff − BCV calibration for O-type stars, (their Eq. (4)). A renewed calibration was derived from our new temperatures, which extended to SpT < O4 by combining it with the stellar parameters from Rivero González et al. (2012b) and Doran & Crowther (2011). Only very minimal variations in BCV were shown between different luminosity classes.
Appendix A.1.3: O-type star ionising luminosities
MSH05 also derived a q0(Teff, log g) function, but with the new Teff that we assigned, their same q0 values could not be directly adopted. Instead, as was done with the BCV, we combined these values with data from Rivero González et al. (2012a,b) and Doran & Crowther (2011), along with Mokiem et al. (2004) and Smith et al. (2002), in order to sample the higher Teff range and determined new separate relations for the dwarf, giant and supergiant luminosity classes.
Average absolute magnitudes of OB stars in the census.
Appendix A.1.4: O-type star wind velocities and mass-loss rates
An extensive observational study in the UV of the terminal velocities of Galactic
OB stars was made by Prinja et al. (1990).
The ν∞ assigned to our different SpTs were primarily based on the mean
values given in their Table 3 with slight updates made to incorporate the later work
of Prinja & Crowther (1998), Massey et al. (2004) and Doran & Crowther (2011), who studied further O-type stars,
this time in the Magellanic Clouds. Measurements did not extend to late SpTs and so
a value for ν∞ was estimated in these cases. Given that the velocities of
Prinja et al. (1990) are for Galactic stars, the metallicity dependence of
ν∞ is noted, Leitherer et al. (1992) deriving a dependence of
ν∞ ∝ Z0.13. With
 , the effect could be substantial.
However, Ṁ is the more dominant term in this case so that any
metallicity dependence of ν∞ should only change the
LSW by up to ~10%.
, the effect could be substantial.
However, Ṁ is the more dominant term in this case so that any
metallicity dependence of ν∞ should only change the
LSW by up to ~10%.
For O-type star mass-loss rates we applied the theoretical prescriptions of Vink et al. (2001), entering a LMC metallicity of Z = 0.5 Z⊙, throughout. These predicted mass-loss rates do not directly account for wind clumping but systematic offsets found by Mokiem et al. (2007b) when comparing to empirically determined mass-loss rates, could suggest them to be consistent with a clumped wind, nonetheless.
Appendix A.2: B-type star calibrations
Appendix A.2.1: B-type star temperatures
Trundle et al. (2007) and Hunter et al. (2007) carried out atmospheric modelling on over 100 B-type stars as part of the previous VLT-FLAMES Survey of Massive Stars, many of which were in the LMC. Our B-type star temperature calibration adopts the same scale given in Table 10 of Trundle et al. (2007). Whilst some SpTs needed to be interpolated, we recall that the study only needed to consider the earliest B-type dwarfs and giants and B-type supergiants.
Appendix A.2.2: B-type star intrinsic colours and bolometric corrections
Intrinsic colours for B-type stars were adopted from Table 2.1 of Conti et al. (2008). Crowther et al. (2006) produced a Teff − BCV calibration based on their B-supergiant studies along with the work of Trundle et al. (2004) and Trundle & Lennon (2005). This was applied to all the B-supergiants in the sample. In the case of the earliest B-dwarfs and giants, the relation from Lanz & Hubeny (2003, their Eq. (2)) was used although as with the O-type stars, BCV shows only small changes with luminosity class, with Teff being the dominant factor.
Appendix A.2.3: B-type star ionising luminosities
As with the O-type stars, a q0(Teff) relation was determined for the cooler B-type stars. Based on the data of Mokiem et al. (2007a), Conti et al. (2008) and Smith et al. (2002), separate relations for dwarf, giant and supergiant luminosity classes were made as before.
Breakdown of the SB2 systems that were corrected for in the census.
Appendix A.2.4: B-star wind velocities and mass-loss rates
Prinja et al. (1990) was once again used to assign ν∞ to the B-supergiants with Kudritzki & Puls (2000) offering values to the later SpTs. The early B-dwarfs and giants in the census were assumed to have similar ν∞ to their late O-type star counterparts, while their Ṁ was supplied by the Vink et al. (2001) prescription. An exception was made for B-supergiants, however, following a discrepancy between the prescription and empirical results (Markova & Puls 2008; Crowther et al. 2006; Trundle & Lennon 2005). In these cases we employed the Wind-Luminosity Relation (WLR) of Kudritzki et al. (1999), whereby the modified wind momentum (Dmom = Ṁν∞R0.5) relates to the stellar luminosity. We adopt B-supergiant parameters from past studies (Markova & Puls 2008; Lefever et al. 2007; Crowther et al. 2006; Kudritzki et al. 1999) to plot log Dmom vs. log L. The sample was split into early and mid/late type stars (as in Crowther et al. (2006), their Fig. 7) before a least squares fit was made and used to estimate Ṁ. Despite discrepancies with the Vink et al. (2001) predictions, given the relatively small number of B-supergiants in the census, similar integrated properties are expected for 30 Dor, with either mass-loss rate approach.
Appendix B: W-R and Of/WN stars
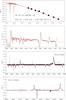 |
Fig. B.1
Spectral fitting for O2 If*/WN 5 template star BAT99-12/Sk –67° 22. |
| Open with DEXTER | |
All of the W-R stars relied on narrow band photometry for accurate determination of their stellar properties. In many cases, this could be adopted from the works of Crowther & Hadfield (2006), Schmutz & Vacca (1991), and Torres-Dodgen & Massey (1988). For the remainder, spectrophotometry of various data sets was required such as Crowther & Smith (1997) and the HST/FOS observations of de Koter et al. (1997) and Massey & Hunter (1998) (see Table B.2).
Intrinsic colours of all WN stars used the (b − v)0-Wλ(4686) relation from Crowther & Hadfield (2006), where Wλ(4686) was measured from the available spectroscopy or adopted from Schnurr et al. (2008). In the case of WC stars, (b − v)0 was adopted from Crowther & Hadfield (2006) if available, otherwise an average (b − v)0 = −0.28 was applied to single WC stars and (b − v)0 = −0.32 to WC binaries where an O-type star dominated the light.
While the VFTS had made observations of 23 of the W-R and Of/WN stars, analysis was not straight forward as spectra were not flux calibrated. Furthermore, it lacked large sections at the yellow and red wavelengths, which hold important diagnostic lines for W-R star modelling. The nine stars listed in Table B.1, one for each subtype, were the stars selected as templates for the rest of the census. Fortunately, additional flux calibrated spectra were available for most of these stars, upon which our CMFGEN models were principally based. Figures B.1–B.9 provide a comparison between the CMFGEN models (red) and the observed spectra (black). Photometric data is also plotted over the CMFGEN spectral energy distributions: broad band photometry (filled squares), narrow band photometry (open squares).
Appendix B.1: W-R binaries
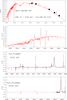 |
Fig. B.2
Spectral fitting for O3.5 If*/WN 7 template star Melnick 51/VFTS 457. |
| Open with DEXTER | |
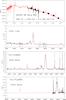 |
Fig. B.3
Spectral fitting for WN 3 template star BAT99-86/Brey 69/VFTS 019. |
| Open with DEXTER | |
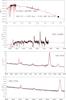 |
Fig. B.4
Spectral fitting for WN 5 template star BAT99-106/Brey 82/R136a3. |
| Open with DEXTER | |
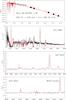 |
Fig. B.5
Spectral fitting for WN 6 template star BAT99-118/Brey 89. |
| Open with DEXTER | |
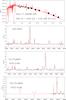 |
Fig. B.6
Spectral fitting for WN 7 template star BAT99-89/Brey 71/VFTS 108. |
| Open with DEXTER | |
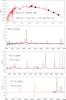 |
Fig. B.7
Spectral fitting for WN 8 template star BAT99-96/Brey 81/VFTS 427. |
| Open with DEXTER | |
Template W-R and Of/WN star models. Input spectra were both flux calibrated (bold) and non-flux calibrated.
Photometric properties of all the W-R stars in 30 Dor.
Schnurr et al. (2008), Foellmi et al. (2003) and Bartzakos et al. (2001) all made studies into the binary nature of W-R stars in the LMC. The VFTS supplied new spectra for 19 W-R stars, allowing a fresh look for possible binary candidates with its multi-epoch observations. Updates to previous classifications were given in Table 2 of Paper I.
In order to determine the desired W-R magnitude
( ) from the observed magnitude of a
multiple system (
) from the observed magnitude of a
multiple system ( ), we used the dilution of different
emission lines. For a single undiluted WN 6 star, the strength of the He ii
λ4686 line was taken to be
Wλ(4686) ≈ 75 Å (Crowther & Smith 1997). Similarly, for a single
undiluted WC 4-5 star, the strength of the C iv λ5808 line
was assumed to be Wλ(5808) ≈ 1400 Å
(Crowther & Hadfield 2006). In a binary,
the Wλ would fall as it is diluted by the
additional continuum flux of the companion. This reduction in
Wλ relates to the ratio of the
continuum fluxes of the two stars, and in turn gives the difference in their apparent
magnitudes. As some WN stars do show variation in these line widths, in the case of
binary WN/C star (BAT99-92), comparisons were made to the other single WN/C star
(BAT99-88) for which Wλ(4686) = 225 Å
and Wλ(5808) = 1600 Å.
), we used the dilution of different
emission lines. For a single undiluted WN 6 star, the strength of the He ii
λ4686 line was taken to be
Wλ(4686) ≈ 75 Å (Crowther & Smith 1997). Similarly, for a single
undiluted WC 4-5 star, the strength of the C iv λ5808 line
was assumed to be Wλ(5808) ≈ 1400 Å
(Crowther & Hadfield 2006). In a binary,
the Wλ would fall as it is diluted by the
additional continuum flux of the companion. This reduction in
Wλ relates to the ratio of the
continuum fluxes of the two stars, and in turn gives the difference in their apparent
magnitudes. As some WN stars do show variation in these line widths, in the case of
binary WN/C star (BAT99-92), comparisons were made to the other single WN/C star
(BAT99-88) for which Wλ(4686) = 225 Å
and Wλ(5808) = 1600 Å.
The necessary corrections made to the photometry are given in Table B.2. Further spectroscopic comments on the VFTS binary candidates are made below.
ID# 24/VFTS 019/BAT99-86/Brey 69 – Foellmi et al. (2003) had classified this star as WN3o+O9: but noted no radial velocity (RV) changes over their epochs. VFTS spectra also showed no RV variation and no absorption either, even in the Balmer lines, supporting a single system. Note, however, upon further inspection of the Pickering lines, a WN 3(h) classification was favoured over that listed in Table 2 of Paper I.
ID#375/VFTS 402/BAT99-95/Brey 80 – Absorption was noted in the Balmer and He i λ4387 lines. This coincided with RV changes (but no absorption) in the He ii λ4200 & λ4541 lines. The only exception being He ii λ6683 and N iv λ4057, both showing variations caused by a possible OB companion.
ID#543+544/VFTS 507/BAT99-101+102/Brey 87 – The previous Bartzakos et al. (2001) classification was used to split our narrowband photometry in Table B.2 into the respective R140a1 and R140a2 components, but we were unable to classify O-type star companion from VFTS spectra.
ID# 545/VFTS 509/BAT99-103/Brey 87 – The VFTS spectra favoured a WN 5(h) classification based on the N iv/N iii ratio. The two companions noted were suggested by a series of absorption features. The first came from a set of absorption lines at He i (λ4026 & λ4471) showing a large velocity shift with respect to the rest frame. This shifted absorption was reflected in the Balmer lines and slightly in the He ii lines although not always at consistent epochs. This favoured an O-type orbiting companion. Additional central underlying absorption appeared in the Balmer, He i and He ii lines, this time showing no velocity shift. This favoured an early O-type star that was separate from the system.
ID# 727/VFTS 542/BAT99-113 – Details for the new classification can be found in Crowther & Walborn (2011). Regarding the binary nature, increased absorption in the Balmer lines was noted coinciding with slightly narrower He i λ4026 absorption. He ii lines showed small radial velocity changes but no changes to strength to suggest a late O/early B companion.
ID# 928/VFTS 682 – A new W-R star identified in Paper I. Classified a WN 5h, the VFTS spectra showed no RV variations to suggest a companion. See also Bestenlehner et al. (2011).
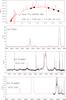 |
Fig. B.8
Spectral fitting for WN/C template star BAT99-88/Brey 70a/VFTS 079. |
| Open with DEXTER | |
ID# 938/VFTS 695/BAT99-119/Brey 90 – Absorption features present in He ii λ4200 & λ4541 with absorption coinciding in He i λ4026 & λ4471 on at least one epoch, if not more. However, Balmer lines showed minimal variations, with no changes to Hγ and only small changes in Hδ peak intensity. A robust classification for the companion remains unknown.
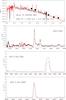 |
Fig. B.9
Spectral fitting for WC 4 template star BAT99-90/Brey 74. |
| Open with DEXTER | |
Appendix C: Reddening
A recent tailored analysis, based on the VFTS O-type stars, indicates a varied amount of extinction across the different regions of 30 Dor (Maíz Apellániz et al., in prep.). For now we apply a uniform reddening value of RV = 3.5 within the MEDUSA region and RV = 4.2 within the R136 region. These values were derived using additional K-band photometry of the census stars, VLT-MAD observations from Campbell et al. (2010) supplying the R136 region and the InfraRed Survey Facility (IRSF, see Table 6 of Paper I) supplying other stars. Martins & Plez (2006) offer a (V − K)o calibration for O-type stars allowing an expected MV to be derived from the K-band photometry. This K-band derived MV would become consistent with the conventionally derived MV from optical photometry, at an average RV value.
For both regions, a K-band extinction of
AK = 0.17 mag was adopted. Figure 1a compares the K-band derived
MV
( ) in the R136 region to the
MV from the original HST/WFC3 photometry
of De Marchi et al. (2011)
(
) in the R136 region to the
MV from the original HST/WFC3 photometry
of De Marchi et al. (2011)
( ). In theory, both values would be equal
with all points falling on the 1:1 relationship line. Despite some scattering, most
likely where VLT-MAD photometry became less reliable in the core, a value of
RV = 4.2 was favoured within R136. In the
case of the MEDUSA region (Fig. 1b), only known single VFTS O-type stars were used in
the comparison. The K-band derived
MV
(
). In theory, both values would be equal
with all points falling on the 1:1 relationship line. Despite some scattering, most
likely where VLT-MAD photometry became less reliable in the core, a value of
RV = 4.2 was favoured within R136. In the
case of the MEDUSA region (Fig. 1b), only known single VFTS O-type stars were used in
the comparison. The K-band derived
MV
( ) was compared to the
MV from the original VFTS photometry
(
) was compared to the
MV from the original VFTS photometry
( ), i.e. using Selman, WFI, Parker or CTIO
photometry, and favoured a lower value of
RV = 3.5.
), i.e. using Selman, WFI, Parker or CTIO
photometry, and favoured a lower value of
RV = 3.5.
An equivalent narrowband Rv was required to match the photometry of the W-R stars. We determined this using Eq. (24) of Schmutz & Vacca (1991).
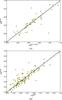 |
Fig. C.1
Determination of RV for 30 Dor. In the R136 region a): the MV of single O-type stars derived from HST/WFC3 photometry is plotted against the expected MV derived from VLT-MAD K-band photometry after applying the Martins & Plez (2006) calibration. In the MEDUSA region b): the MV derived from VFTS photometry is plotted against the expected MV derived from IRSF K-band photometry after applying the Martins & Plez (2006) calibration. Solid lines indicate the 1:1 relations. |
| Open with DEXTER | |
Appendix D: The census
Stellar parameters of the spectroscopically confirmed hot luminous stars in the census.
© ESO, 2013
Current usage metrics show cumulative count of Article Views (full-text article views including HTML views, PDF and ePub downloads, according to the available data) and Abstracts Views on Vision4Press platform.
Data correspond to usage on the plateform after 2015. The current usage metrics is available 48-96 hours after online publication and is updated daily on week days.
Initial download of the metrics may take a while.