Fig. C.1
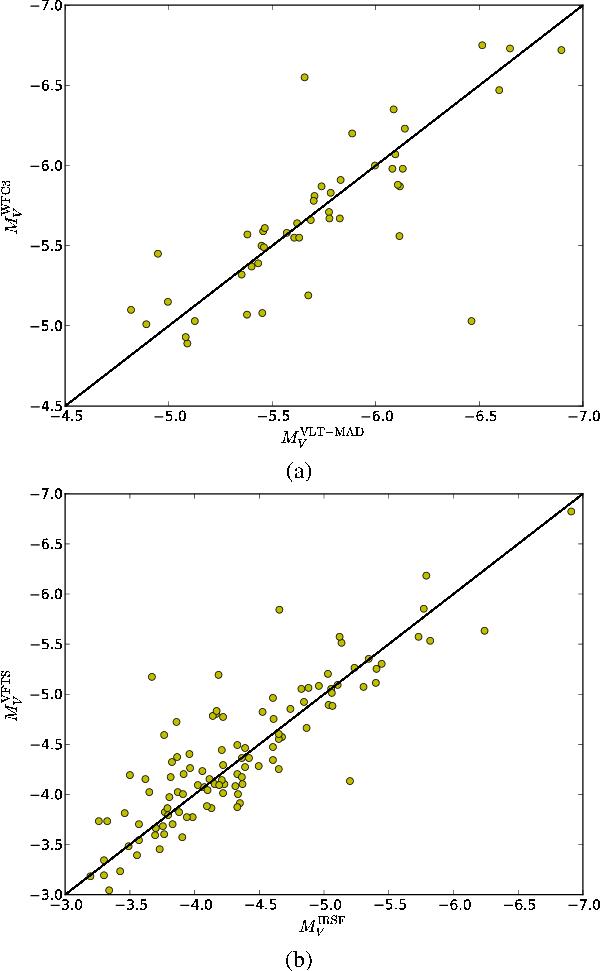
Determination of RV for 30 Dor. In the R136 region a): the MV of single O-type stars derived from HST/WFC3 photometry is plotted against the expected MV derived from VLT-MAD K-band photometry after applying the Martins & Plez (2006) calibration. In the MEDUSA region b): the MV derived from VFTS photometry is plotted against the expected MV derived from IRSF K-band photometry after applying the Martins & Plez (2006) calibration. Solid lines indicate the 1:1 relations.
Current usage metrics show cumulative count of Article Views (full-text article views including HTML views, PDF and ePub downloads, according to the available data) and Abstracts Views on Vision4Press platform.
Data correspond to usage on the plateform after 2015. The current usage metrics is available 48-96 hours after online publication and is updated daily on week days.
Initial download of the metrics may take a while.