| Issue |
A&A
Volume 558, October 2013
|
|
|---|---|---|
| Article Number | A88 | |
| Number of page(s) | 22 | |
| Section | Interstellar and circumstellar matter | |
| DOI | https://doi.org/10.1051/0004-6361/201220452 | |
| Published online | 09 October 2013 | |
Online material
Appendix A: Spitzer spectral line maps of Serpens SE
Spitzer/IRS maps presented at their full extent and resolution. Maps of the pure rotational H2 lines S(2)–S(7) falling in the SL module wavelength range are presented in Fig. 1. For reference, the positions of SMM3 and SMM4 are indicated with filled orange circles. To obtain maximum coverage, both on and off positions were used for the compilation of the SL1 and SL2 module data-cubes. This extended coverage appears to the N or the S (SL2 and SL1 modules, respectively) of SMM3 and SMM4. The resolution of the SL maps is 3.5″ per spaxel, and weak emission-like stripes are due to residual rogue pixels during the reduction. Figure A.2 presents the S(1) and S(0) H2 line maps, and those corresponding to atomic lines from [SI], [FeII], and [SiII] (at 25.2, 26.0, and 34.8 μm). The LL map resolution is 10.5″ per spaxel.
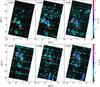 |
Fig. A.1
Spitzer/IRS H2 maps obtained with the SL modules at a resolution of 3.5″/spaxel. |
| Open with DEXTER | |
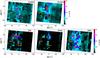 |
Fig. A.2
Spitzer/IRS line maps of the S(0)l and S(1) H2 transitions, along with atomic line maps from the LL modules at a resolution of 10.5″/spaxel. |
| Open with DEXTER | |
Appendix B: Short description of the POMAC code
The POMAC (Poor-man’s CLEAN) algorithm (Lindberg et al. 2013) is a deconvolution algorithm used to separate point sources from extended emission in PACS data. The code is a modified version of the CLEAN algorithm (Hogbom 1974) with the difference that it requires the positions of testing point sources. These points in the present case are selected to be the spaxels displaying emission maxima. The code produces instrument PSFs corresponding to point sources in each pre-defined point source position for the wavelength of the spectral line (or continuum emission) that is to be deconvolved. This is constructed by assuming that the Herschel telescope primary beam is a Rayleigh-criterion Gaussian, which is then overlaid on the PACS spaxel grid to measure how much of the Gaussian falls into each spaxel.
After the PSFs have been determined, the CLEAN part of the code commences. It studies the line (or continuum) emission in the PACS grid to find the pre-defined point source responsible for the strongest flux in the field. A fraction of this flux convolved with the PSF of that point source is subtracted from the line map, and the subtracted flux is added to the cleaned flux of this point source. This step is then repeated until certain stop criteria are met. The remaining flux in the residual map is then composed of extended emission and emission from any unknown point sources, and the cleaned line fluxes correspond to that of the point sources. Note that the residual map is non-deconvolved and shall not be interpreted as a deconvolved map of the extended emission. Finally, the sum of the cleaned flux and the residual flux is compared to the original map as a consistency check. For a well-centered point source without extended emission (such as the continuum emission of HD100546), the results of this method agree well with the results from the PSF correction factor method (the differences are less than 20% across the PACS band).
Appendix C: Excitation diagrams
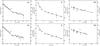 |
Fig. C.1
Excitation diagrams for CO, H2 and H2O at SMM3c and SMM3r (upper and lower panels, respectively.) |
| Open with DEXTER | |
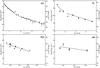 |
Fig. C.2
Excitation diagrams for CO, H2, H2O and OH at SMM4c. |
| Open with DEXTER | |
© ESO, 2013
Current usage metrics show cumulative count of Article Views (full-text article views including HTML views, PDF and ePub downloads, according to the available data) and Abstracts Views on Vision4Press platform.
Data correspond to usage on the plateform after 2015. The current usage metrics is available 48-96 hours after online publication and is updated daily on week days.
Initial download of the metrics may take a while.